
Premium and discount zones are one of the simplest ideas in trading — price above the midpoint of a range is “expensive,” price below it is “cheap.” The problem is that almost every trader draws that range differently. Load the same chart on three different laptops and you’ll get three different premium/discount maps, because everyone anchors the range to a different swing high and low, on a different timeframe. That’s exactly the gap this premium and discount zones indicator is built to close.
Table of Contents
- The problem with manual premium/discount zones
- How the Dealing Range Map is built
- Adding the machine learning layer
- Live Entry Zone detection: the actual edge
- Reading the signals on your chart
- Premium and Discount Zones Indicator: Settings Worth Knowing
- Alerts and PickMyTrade automation
- Limitations (read before trading it live)
- Premium and Discount Zones Indicator FAQ
- Complete Pine Script source code
Premium/Discount ML Zones [PickMyTrade] fixes the first problem by anchoring the entire map to a single higher timeframe, so the zones don’t shift depending on which chart you happen to be looking at. Then it goes a step further: instead of treating every inch of the discount zone as equally “buyable,” it runs a lightweight machine learning model over the range in real time to find the specific band where the data says price actually has an edge.
It’s free, built entirely in Pine Script v6, and open-source under the Mozilla Public License 2.0.
The problem with manual premium/discount zones
Two issues come up constantly when traders use premium/discount concepts:
- The zones aren’t consistent across timeframes. A daily chart’s discount zone and a 15-minute chart’s discount zone rarely agree, because each is calculated independently from whatever swing points are visible on that timeframe.
- Being “in discount” doesn’t mean the trade works. Price can sit in the bottom half of a range for hours without ever producing a tradeable bounce. Location alone isn’t a signal — it’s context.
Premium/Discount ML Zones addresses both by anchoring the map to one fixed higher timeframe so it stays consistent everywhere you look, and by layering a model on top that scores where inside that zone the odds are actually favorable.
How the Dealing Range Map is built
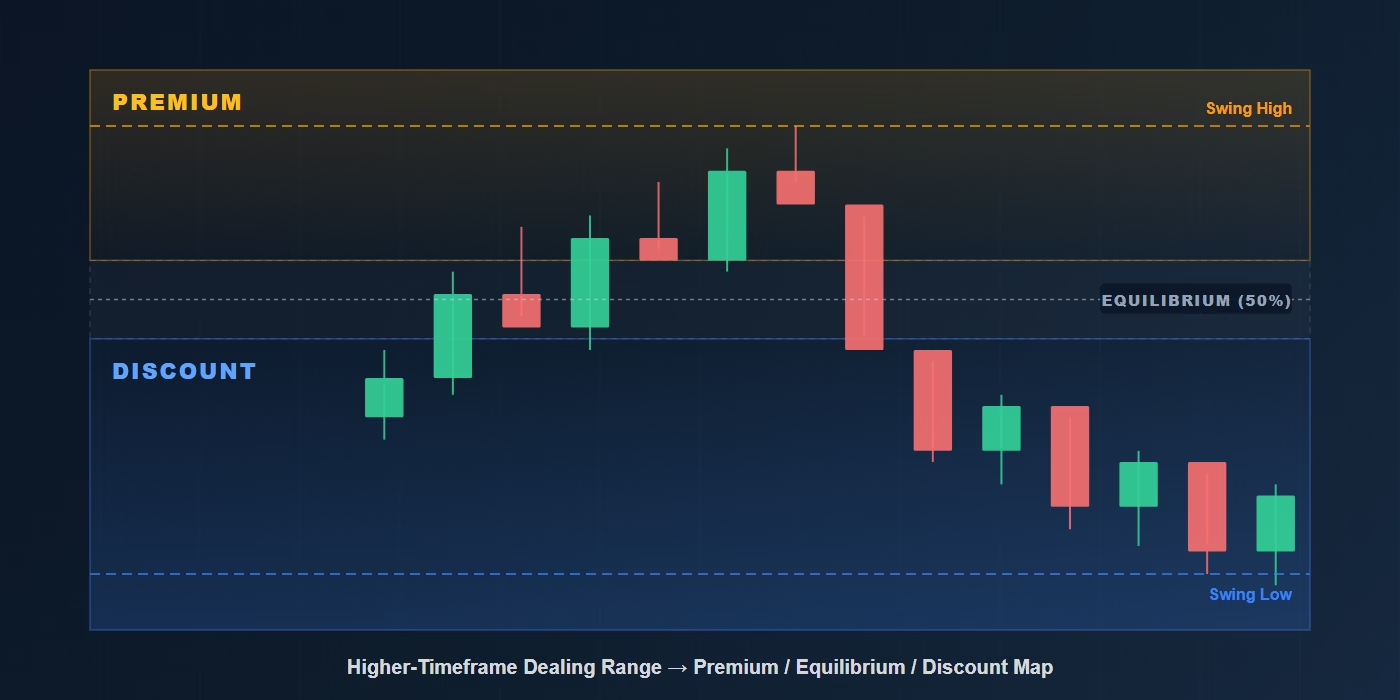
This premium and discount zones indicator starts with a classic dealing range:
- It finds anchored swing highs and lows on a higher timeframe (Daily by default, configurable).
- The midpoint of that range becomes Equilibrium.
- Everything above the midpoint is the Premium zone (potential short territory).
- Everything below the midpoint is the Discount zone (potential long territory).
- A small band around the midpoint — plus or minus 10% by default — is treated as Equilibrium, a dead zone where no signals fire at all.
Because the range is pulled from a single higher timeframe via request.security(), the same three zones appear whether you’re viewing a 5-minute chart or an hourly chart. Swing detection carries the usual confirmation delay of the anchor timeframe (about 3 days with the default Daily setting and 3/3 swing bars), which is a deliberate trade-off for stability over speed.
Adding the machine learning layer
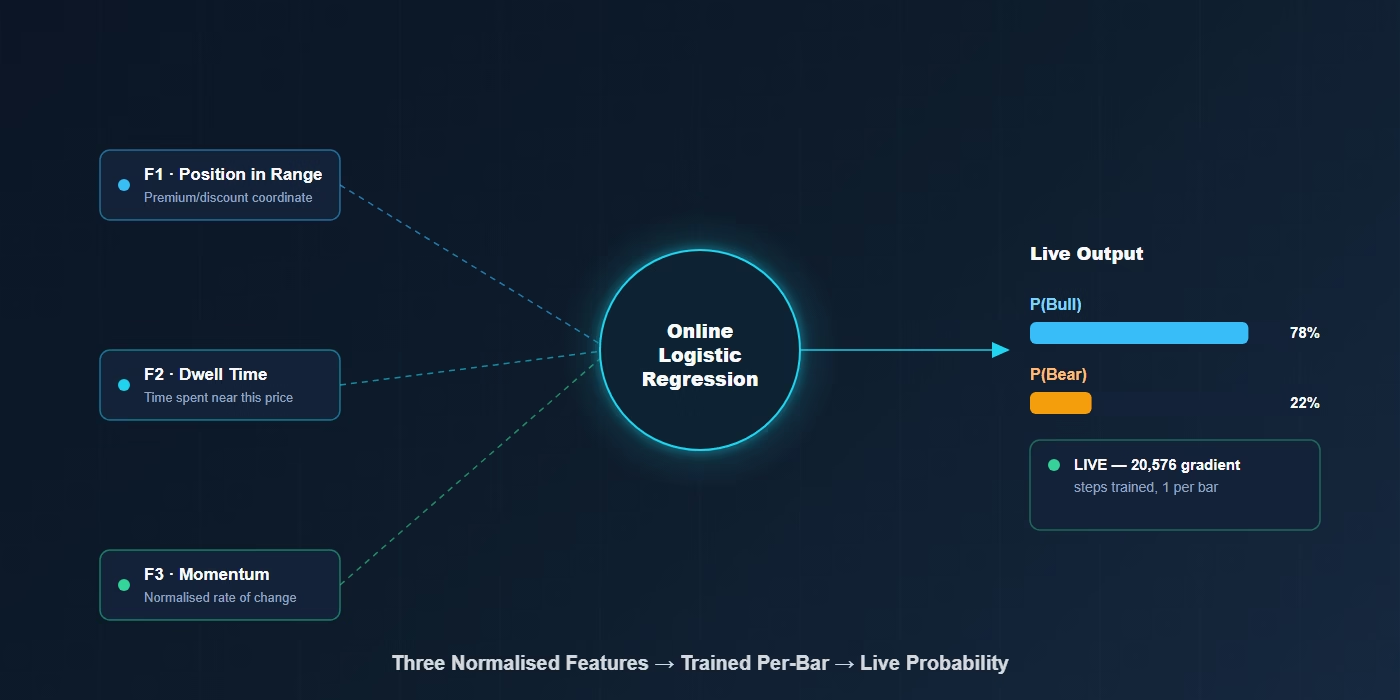
This is where the indicator earns the “ML” in its name. Once the dealing range is built, it trains an online logistic regression model — updated one gradient step per closed bar, with no separate offline training step — on three normalized features:
- Position in range — the premium/discount coordinate of the current price
- Dwell time — how many recent closes have printed near this price level, used as a bar-based proxy for time-at-price
- Momentum — a normalized rate-of-change reading
Each confirmed bar gets labeled based on its forward return over a configurable horizon, and the model updates its weights using that label, always evaluated against the previous bar’s features to avoid look-ahead bias. An L2 regularization term keeps individual feature weights from blowing up during strong trends, while the bias term is left unregularized so the model retains a sense of the base rate.
The model needs a warm-up period — 80 gradient steps by default — before it starts firing signals. Until then, it displays a “WARMUP” status instead of trading probabilities.
Live Entry Zone detection: the actual edge
A lot of “AI indicators” just score the current bar and stop there. This one asks a more useful question: if price were sitting at any other level inside the discount or premium zone, with today’s momentum and dwell characteristics, what would the model predict?
It runs that counterfactual across every price level in the zone and highlights the contiguous band where predicted probability clears the entry threshold (0.65 by default) — effectively finding the exact sub-zone within “discount” or “premium” that the model currently rates as tradeable, rather than treating the whole half of the range as one signal.
Reading the signals on your chart
- Blue zone — Discount area (long bias)
- Orange zone — Premium area (short bias)
- Grey zone — Equilibrium (no signals fire here by design)
- Bright band inside a zone — the ML-detected entry zone, with peak probability labeled
- Blue circle — high-conviction long (probability 0.85 or higher)
- Blue triangle — standard long (probability at or above entry threshold)
- Orange circle/triangle — short equivalents
Only the first bar of a signal cluster fires — if conditions stay favorable for several bars in a row, you get one signal, not a repeated stream of them. An on-chart info table shows live model status (LIVE/WARMUP), current probability readings, and the total number of training updates the model has processed.
Premium and Discount Zones Indicator: Settings Worth Knowing
Dealing Range
- Dealing Range Timeframe — default Daily
- Swing Left/Right Bars — default 3/3
- Equilibrium Band width — default plus or minus 10%
Logistic Regression
- Training Samples Needed — default 80 gradient steps before signals activate
- Entry Threshold — default 0.65 probability
- Learning Rate — default 0.05
- L2 Regularization — default 0.001
- Label Horizon, Momentum Length, Z-Score Window — all configurable
Display
- Toggle Premium/Discount Map on/off
- Show/hide ML Entry Zone
- Zen Mode for a minimalist chart
- Risk/Reward ratio for the auto-plotted stop/target lines
Alerts and PickMyTrade automation
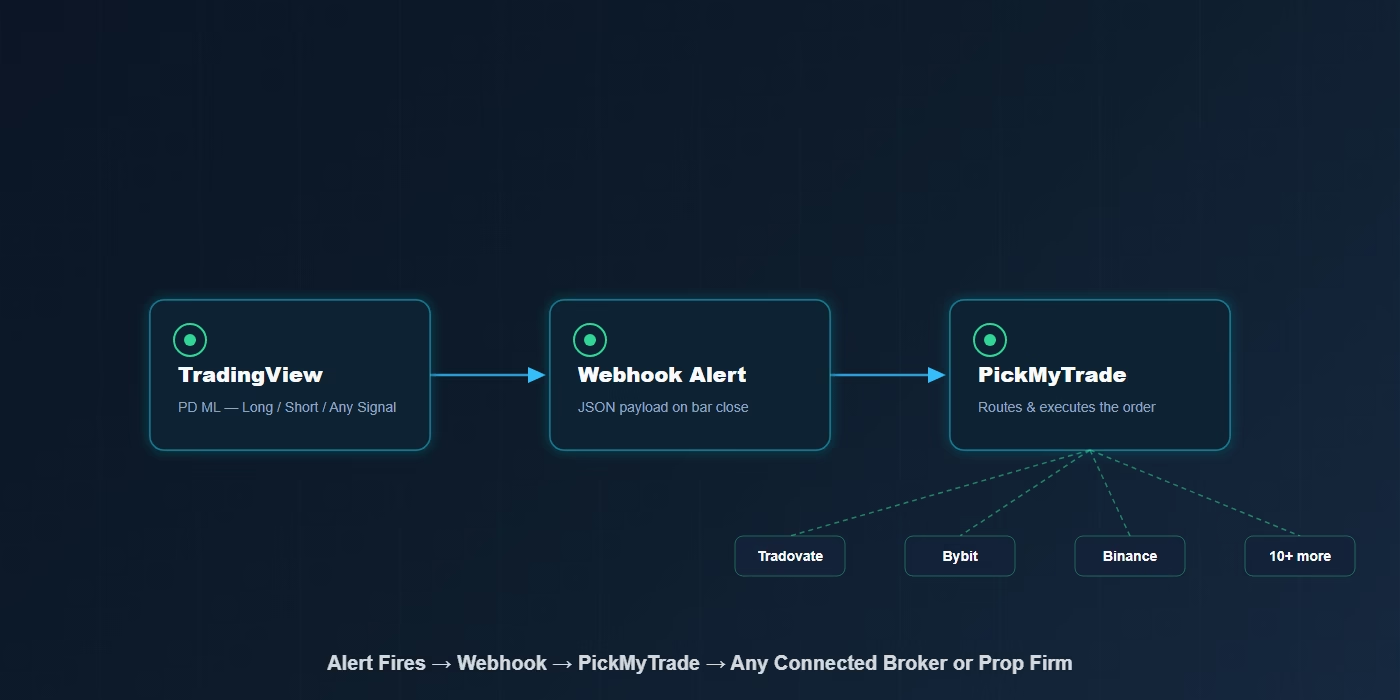
The indicator ships with three ready-made alerts:
- PD ML – Long
- PD ML – Short
- PD ML – Any Signal
Point any of these at a PickMyTrade webhook and you can route the signal straight into automated order execution — no manual chart-watching required — this premium and discount zones indicator is built to plug straight into that workflow. If you’re new to connecting TradingView alerts to a broker or prop firm account, see our guide on TradingView plans for webhook automated trading and the Institutional Order Flow indicator walkthrough for a similar setup process.
Limitations (read before trading it live)
- Needs a minimum number of training samples before it activates; switching charts or timeframes resets learning from zero.
- Assumes a roughly monotonic relationship between features and outcomes — real markets don’t always cooperate.
- Probabilities describe historical patterns, not a guarantee of future profitability.
- The model only knows about the anchor timeframe’s range — a daily “discount” can still sit inside a weekly “premium,” and the indicator won’t tell you that on its own.
- Swing confirmation on the anchor timeframe introduces a delay (about 3 days with Daily defaults).
- The Equilibrium band is intentionally dead space — don’t expect signals there.
Premium and Discount Zones Indicator FAQ
Does it repaint?
No. Signals and the dealing-range swings are confirmed on bar close before the model acts on them.
What markets and timeframes does it work on?
Any market and any timeframe available on TradingView — the higher-timeframe anchor is independent of your chart’s timeframe.
Do I need a paid TradingView plan?
No, the indicator itself is free on any TradingView plan. Automating the alerts through PickMyTrade requires a PickMyTrade account.
How is this different from manually drawing premium/discount zones?
Manual zones depend on which swing points you pick and shift every time you redraw them. This premium and discount zones indicator anchors to one fixed higher timeframe and adds a trained model to flag where inside the zone the odds currently favor a trade, instead of treating the whole zone as one signal.
Is the source code open?
Yes — it’s published under the Mozilla Public License 2.0, so you can inspect or modify it on TradingView.
Get the indicator: Premium/Discount ML Zones [PickMyTrade] on TradingView
Automate it: Connect the alerts to your prop firm or broker account with PickMyTrade.
Complete Pine Script source code
The indicator is open-source under the Mozilla Public License 2.0. Full source (297 lines, Pine Script v6):
// This Pine Script® code is subject to the terms of the Mozilla Public License 2.0
// © PickMyTrade — Premium/Discount ML Zones [PickMyTrade]: HTF Dealing Range + Online Logistic Regression

//@version=6
indicator(
     title = "Premium/Discount ML Zones [PickMyTrade]",
     shorttitle = "PD ML",
     overlay = true,
     max_boxes_count = 30,
     max_lines_count = 30,
     max_labels_count = 30,
     max_bars_back = 500
     )

var string G_RANGE = "Dealing Range"
var string G_DWELL = "Dwell-Time Feature"
var string G_ML = "Logistic Regression"
var string G_RISK = "Signal Levels"
var string G_VIS = "Visual"
var string G_ZEN = "Display"

i_range_tf = input.timeframe("D", "Dealing Range Timeframe", group=G_RANGE, tooltip="Whose swings define the Premium & Discount halves. Because the range is read from THIS timeframe, the map stays at the same prices no matter which chart timeframe you view. Set it EQUAL TO OR HIGHER than your execution chart (e.g. Daily range while executing on 5m). Blank = use the chart timeframe (not recommended — micro ranges on low timeframes are what make Premium/Discount meaningless).")
i_piv_left = input.int(3, "Swing Left Bars", minval=1, maxval=20, group=G_RANGE, tooltip="Bars to the LEFT of a swing point, counted on the Dealing Range Timeframe. Larger = only bigger, rarer swings anchor the range.")
i_piv_right = input.int(3, "Swing Right Bars", minval=1, maxval=20, group=G_RANGE, tooltip="Bars to the RIGHT needed to CONFIRM a swing. This is the confirmation delay — the range re-anchors this many Dealing-Range-Timeframe bars after a swing forms. Keeps it non-repainting; larger = slower but more reliable anchors.")
i_eq_band = input.float(0.10, "Equilibrium Band (± % of range)", minval=0.0, maxval=0.25, step=0.01, group=G_RANGE, tooltip="Half-width of the neutral Equilibrium zone around the 50% midpoint, as a fraction of the range. 0.10 = the middle 20% (40%–60%) is fair value — price there is neither cheap nor expensive, so NO signals fire in it. Set 0 to collapse it back to a single line.")

i_nbins = input.int(20, "Scan / Dwell Bands", minval=5, maxval=50, group=G_DWELL, tooltip="Price-level resolution used both for the ML entry-zone scan and the dwell feature. Higher = finer bands.")
i_dwell_lb = input.int(50, "Dwell Lookback (bars)", minval=10, maxval=300, group=G_DWELL, tooltip="How many recent bars are scanned to measure time-at-price (ML feature F2).")

i_train_lookback = input.int(80, "Training Samples Needed", minval=20, maxval=400, group=G_ML, tooltip="Gradient updates needed before signals and the ML zone are considered warmed up.")
i_posterior_thresh = input.float(0.65, "Entry Threshold", minval=0.51, maxval=0.95, step=0.01, group=G_ML, tooltip="Minimum model probability required to fire a signal and to light up the ML entry zone.")
i_learn_rate = input.float(0.05, "Learning Rate", minval=0.001, maxval=0.5, step=0.001, group=G_ML, tooltip="Gradient-descent step size. Higher = faster but noisier.")
i_l2_lambda = input.float(0.001, "L2 Regularization", minval=0.0, maxval=0.1, step=0.001, group=G_ML, tooltip="Weight decay. Prevents weights drifting to overfit extremes. 0 = off.")
i_label_period = input.int(5, "Label Horizon (bars)", minval=2, maxval=30, group=G_ML, tooltip="Bars ahead used to build the training label.")
i_mom_len = input.int(14, "Momentum Length", minval=3, maxval=60, group=G_ML, tooltip="Rate-of-change window for the momentum feature (F3).")
i_zscore_len = input.int(50, "Z-Score Window", minval=10, maxval=200, group=G_ML, tooltip="Normalisation window applied to all three features.")

i_show_levels = input.bool(true, "Show SL / TP Lines", group=G_RISK)
i_atr_period = input.int(14, "ATR Period", minval=5, maxval=50, group=G_RISK, tooltip="ATR period for the reference stop-loss buffer.")
i_sl_atr_mult = input.float(1.2, "SL ATR Buffer", minval=0.2, maxval=5.0, step=0.1, group=G_RISK, active=i_show_levels, tooltip="ATR buffer beyond the range extreme for the reference stop-loss.")
i_rr_ratio = input.float(1.8, "Risk : Reward", minval=0.5, maxval=6.0, step=0.1, group=G_RISK, active=i_show_levels, tooltip="Reference take-profit distance as a multiple of the stop distance.")

i_show_zones = input.bool(true, "Show Premium/Discount Map", group=G_VIS, tooltip="The faint upper (Premium) / lower (Discount) halves and the equilibrium line — the structural map.")
i_show_ote = input.bool(true, "Show ML Entry Zone", group=G_VIS, tooltip="The bright band the model detects inside each half — the exact price range where a signal would currently fire.")
i_zone_back = input.int(80, "Zone Left Extent (bars)", minval=10, maxval=500, group=G_VIS, tooltip="How many bars back the zones are drawn from the current bar.")
i_zone_extend = input.int(30, "Zone Forward Extend (bars)", minval=0, maxval=200, group=G_VIS, tooltip="How many bars past the current bar the zones project forward.")
i_show_eq = input.bool(true, "Show Equilibrium Line", group=G_VIS)
i_show_bg = input.bool(true, "Regime Background", group=G_VIS)
i_disc_col = input.color(color.new(#2962FF, 82), "Discount Colour", group=G_VIS)
i_prem_col = input.color(color.new(#FF6D00, 82), "Premium Colour", group=G_VIS)
i_eq_col = input.color(#787B86, "Equilibrium Colour", group=G_VIS, tooltip="Neutral fill for the fair-value band between Premium and Discount.")

i_zen_mode = input.bool(false, "Zen Mode", group=G_ZEN, tooltip="Hides the SL/TP lines and the info table. The map and ML zone remain.")
i_show_table = input.bool(true, "Show Info Table", group=G_ZEN)

// ── DEALING RANGE — anchored to CONFIRMED SWINGS on the anchor timeframe ───
htf = i_range_tf == "" ? timeframe.period : i_range_tf
[ph, pl] = request.security(syminfo.tickerid, htf, [ta.pivothigh(i_piv_left, i_piv_right), ta.pivotlow(i_piv_left, i_piv_right)], lookahead=barmerge.lookahead_off)

var float swingHigh = na
var float swingLow = na

if not na(ph) and (na(swingLow) or ph > swingLow)
    swingHigh := ph
if not na(pl) and (na(swingHigh) or pl < swingHigh)
    swingLow := pl

rangeHigh = swingHigh
rangeLow = swingLow

range_valid = not na(rangeHigh) and not na(rangeLow) and rangeHigh > rangeLow
range_size = range_valid ? rangeHigh - rangeLow : na
equilibrium = range_valid ? (rangeHigh + rangeLow) / 2 : na

eq_top = range_valid ? equilibrium + i_eq_band * range_size : na
eq_bot = range_valid ? equilibrium - i_eq_band * range_size : na

bos_up = range_valid and close > rangeHigh
bos_dn = range_valid and close < rangeLow

in_discount = range_valid and close <= eq_bot
in_premium = range_valid and close >= eq_top
in_equilib = range_valid and not in_discount and not in_premium

// ── FEATURE 1 — position within the range ──────────────────────────────────
pos = range_valid ? (close - rangeLow) / math.max(range_size, syminfo.mintick) : na
pos_clamped = na(pos) ? 0.0 : math.max(0.0, math.min(1.0, pos))
pos_mean = ta.sma(pos_clamped, i_zscore_len)
pos_std = ta.stdev(pos_clamped, i_zscore_len)
f1 = (range_valid and pos_std > 0) ? (pos_clamped - pos_mean) / pos_std : 0.0

// ── FEATURE 2 — dwell-time: rolling time-at-price around the current close ──
var float dwell_density = 0.0
if range_valid and range_size > 0
    float band = range_size / i_nbins
    int cnt = 0
    for i = 0 to i_dwell_lb - 1
        if not na(close[i]) and math.abs(close[i] - close) <= band
            cnt += 1
    dwell_density := (cnt * 1.0) / i_dwell_lb
else
    dwell_density := 0.0
dwell_mean = ta.sma(dwell_density, i_zscore_len)
dwell_std = ta.stdev(dwell_density, i_zscore_len)
f2 = (range_valid and dwell_std > 0) ? (dwell_density - dwell_mean) / dwell_std : 0.0

// ── FEATURE 3 — momentum ───────────────────────────────────────────────────
mom_raw = (close - close[i_mom_len]) / (close[i_mom_len] + syminfo.mintick)
mom_mean = ta.sma(mom_raw, i_zscore_len)
mom_std = ta.stdev(mom_raw, i_zscore_len)
f3 = mom_std > 0 ? (mom_raw - mom_mean) / mom_std : 0.0

// ── ONLINE LOGISTIC REGRESSION — gradient descent, trains on 1-bar lag ─────
fwd_roc = (close - close[i_label_period]) / (close[i_label_period] + syminfo.mintick)
label_bull = fwd_roc > 0

f_sigmoid(float z) => 1.0 / (1.0 + math.exp(-z))

var float w0 = 0.0
var float w1 = 0.0
var float w2 = 0.0
var float w3 = 0.0
var float trained_n = 0.0

if bar_index >= i_zscore_len + i_label_period + 2
    _pred = f_sigmoid(w0 + w1 * f1[1] + w2 * f2[1] + w3 * f3[1])
    _label = label_bull[1] ? 1.0 : 0.0
    _err = _label - _pred
    w0 := w0 + i_learn_rate * _err
    w1 := w1 + i_learn_rate * (_err * f1[1] - i_l2_lambda * w1)
    w2 := w2 + i_learn_rate * (_err * f2[1] - i_l2_lambda * w2)
    w3 := w3 + i_learn_rate * (_err * f3[1] - i_l2_lambda * w3)
    trained_n := trained_n + 1

post_bull = f_sigmoid(w0 + w1 * f1 + w2 * f2 + w3 * f3)
post_bear = 1.0 - post_bull
warmed_up = trained_n >= i_train_lookback

// ── ML ENTRY-ZONE DETECTION ────────────────────────────────────────────────
float ml_long_lo = na
float ml_long_hi = na
float ml_long_p = na
float ml_short_lo = na
float ml_short_hi = na
float ml_short_p = na

if range_valid and warmed_up and pos_std > 0
    base = w0 + w2 * f2 + w3 * f3
    for j = 0 to i_nbins
        float p = rangeLow + (eq_bot - rangeLow) * j / i_nbins
        float f1p = ((p - rangeLow) / range_size - pos_mean) / pos_std
        float pbup = f_sigmoid(base + w1 * f1p)
        if pbup >= i_posterior_thresh
            ml_long_lo := na(ml_long_lo) ? p : math.min(ml_long_lo, p)
            ml_long_hi := na(ml_long_hi) ? p : math.max(ml_long_hi, p)
            ml_long_p := na(ml_long_p) ? pbup : math.max(ml_long_p, pbup)
    for k = 0 to i_nbins
        float p2 = eq_top + (rangeHigh - eq_top) * k / i_nbins
        float f1p2 = ((p2 - rangeLow) / range_size - pos_mean) / pos_std
        float pbep = 1.0 - f_sigmoid(base + w1 * f1p2)
        if pbep >= i_posterior_thresh
            ml_short_lo := na(ml_short_lo) ? p2 : math.min(ml_short_lo, p2)
            ml_short_hi := na(ml_short_hi) ? p2 : math.max(ml_short_hi, p2)
            ml_short_p := na(ml_short_p) ? pbep : math.max(ml_short_p, pbep)

// ── SIGNALS — the model is the trigger; it fires where the ML zone lives ────
atr = ta.atr(i_atr_period)

long_sig = warmed_up and in_discount and not bos_dn and post_bull >= i_posterior_thresh
short_sig = warmed_up and in_premium and not bos_up and post_bear >= i_posterior_thresh

long_entry = long_sig and not long_sig[1]
short_entry = short_sig and not short_sig[1]

long_hi = long_entry and post_bull >= 0.85
short_hi = short_entry and post_bear >= 0.85

// ── DRAW: structural map (Discount / Equilibrium / Premium + midpoint line) ─
var box discBox = na
var box premBox = na
var box eqBox = na
var line eqLine = na

int z_left = bar_index > i_zone_back ? bar_index - i_zone_back : 0
int z_right = bar_index + i_zone_extend

if i_show_zones and range_valid
    if na(discBox)
        discBox := box.new(z_left, eq_bot, z_right, rangeLow, border_color=color.new(i_disc_col, 55), bgcolor=color.new(i_disc_col, 94), text="DISCOUNT", text_size=size.tiny, text_color=color.new(i_disc_col, 15), text_halign=text.align_left, text_valign=text.align_bottom)
        premBox := box.new(z_left, rangeHigh, z_right, eq_top, border_color=color.new(i_prem_col, 55), bgcolor=color.new(i_prem_col, 94), text="PREMIUM", text_size=size.tiny, text_color=color.new(i_prem_col, 15), text_halign=text.align_left, text_valign=text.align_top)
        eqBox := box.new(z_left, eq_top, z_right, eq_bot, border_color=color.new(i_eq_col, 55), bgcolor=color.new(i_eq_col, 88), text="EQUILIBRIUM", text_size=size.tiny, text_color=color.new(i_eq_col, 10), text_halign=text.align_left, text_valign=text.align_center)
    box.set_lefttop(discBox, z_left, eq_bot)
    box.set_rightbottom(discBox, z_right, rangeLow)
    box.set_lefttop(premBox, z_left, rangeHigh)
    box.set_rightbottom(premBox, z_right, eq_top)
    box.set_lefttop(eqBox, z_left, eq_top)
    box.set_rightbottom(eqBox, z_right, eq_bot)

if i_show_eq and range_valid
    if na(eqLine)
        eqLine := line.new(z_left, equilibrium, z_right, equilibrium, color=color.new(color.gray, 20), width=1, style=line.style_dashed)
    line.set_xy1(eqLine, z_left, equilibrium)
    line.set_xy2(eqLine, z_right, equilibrium)

// ── DRAW: ML entry zone (bright, model-detected) ───────────────────────────
var box mlLongBox = na
var box mlShortBox = na

if i_show_ote and range_valid
    if na(mlLongBox)
        mlLongBox := box.new(z_left, na, z_right, na, border_color=color.new(i_disc_col, 0), bgcolor=color.new(i_disc_col, 68), text_size=size.tiny, text_color=color.new(color.white, 0), text_halign=text.align_center, text_valign=text.align_center)
        mlShortBox := box.new(z_left, na, z_right, na, border_color=color.new(i_prem_col, 0), bgcolor=color.new(i_prem_col, 68), text_size=size.tiny, text_color=color.new(color.white, 0), text_halign=text.align_center, text_valign=text.align_center)
    if not na(ml_long_lo)
        box.set_lefttop(mlLongBox, z_left, ml_long_hi)
        box.set_rightbottom(mlLongBox, z_right, ml_long_lo)
        box.set_text(mlLongBox, "ML BUY ZONE · up to " + str.tostring(math.round(ml_long_p * 100)) + "% P(Bull)")
    else
        box.set_top(mlLongBox, na)
        box.set_bottom(mlLongBox, na)
    if not na(ml_short_lo)
        box.set_lefttop(mlShortBox, z_left, ml_short_hi)
        box.set_rightbottom(mlShortBox, z_right, ml_short_lo)
        box.set_text(mlShortBox, "ML SELL ZONE · up to " + str.tostring(math.round(ml_short_p * 100)) + "% P(Bear)")
    else
        box.set_top(mlShortBox, na)
        box.set_bottom(mlShortBox, na)

// ── SIGNAL SHAPES — circle = high conviction (P≥85%), triangle = normal ────
plotshape(long_hi, "PD Long ● High", location=location.belowbar, style=shape.circle, size=size.small, color=color.new(#2962FF, 0))
plotshape(long_entry and not long_hi, "PD Long ▲", location=location.belowbar, style=shape.triangleup, size=size.small, color=color.new(#2962FF, 0))
plotshape(short_hi, "PD Short ● High", location=location.abovebar, style=shape.circle, size=size.small, color=color.new(#FF6D00, 0))
plotshape(short_entry and not short_hi, "PD Short ▼", location=location.abovebar, style=shape.triangledown, size=size.small, color=color.new(#FF6D00, 0))

// ── REGIME BACKGROUND ──────────────────────────────────────────────────────
bgcolor(i_show_bg and long_sig and not i_zen_mode ? color.new(i_disc_col, 93) : na, title="Discount Regime")
bgcolor(i_show_bg and short_sig and not i_zen_mode ? color.new(i_prem_col, 93) : na, title="Premium Regime")

// ── SL / TP REFERENCE LINES (visual only — this is an indicator) ───────────
var line sl_line = na
var line tp_line = na

if long_entry and i_show_levels and not i_zen_mode
    sl_price = math.min(rangeLow - atr * i_sl_atr_mult, close - atr * 0.5)
    tp_price = close + (close - sl_price) * i_rr_ratio
    sl_line := line.new(bar_index, sl_price, bar_index + 8, sl_price, color=color.new(color.red, 30), width=1, style=line.style_dashed)
    tp_line := line.new(bar_index, tp_price, bar_index + 8, tp_price, color=color.new(color.green, 30), width=1, style=line.style_dashed)

if short_entry and i_show_levels and not i_zen_mode
    sl_price = math.max(rangeHigh + atr * i_sl_atr_mult, close + atr * 0.5)
    tp_price = close - (sl_price - close) * i_rr_ratio
    sl_line := line.new(bar_index, sl_price, bar_index + 8, sl_price, color=color.new(color.red, 30), width=1, style=line.style_dashed)
    tp_line := line.new(bar_index, tp_price, bar_index + 8, tp_price, color=color.new(color.green, 30), width=1, style=line.style_dashed)

// ── INFO TABLE ─────────────────────────────────────────────────────────────
var table tbl = table.new(position.top_right, 2, 8, bgcolor=color.new(color.black, 75), border_color=color.new(color.gray, 60), border_width=1, frame_color=color.new(color.gray, 50), frame_width=1)

if barstate.islast and i_show_table
    color txt_wht = color.new(color.white, 0)
    bool in_bos = bos_up or bos_dn
    string zone_lbl = not range_valid ? "No Range" : bos_up ? "BOS ↑" : bos_dn ? "BOS ↓" : in_premium ? "Premium" : in_discount ? "Discount" : "Equilibrium"
    color zone_col = not range_valid ? txt_wht : in_bos ? color.new(color.yellow, 0) : in_premium ? color.new(i_prem_col, 0) : in_discount ? color.new(i_disc_col, 0) : color.new(i_eq_col, 0)

    table.cell(tbl, 0, 0, "PD-ML", text_color=color.new(color.gray, 0), text_size=size.small, bgcolor=color.new(color.black, 60))
    table.cell(tbl, 1, 0, warmed_up ? "● LIVE" : "● WARMUP", text_color=warmed_up ? color.new(color.lime, 0) : color.new(color.yellow, 0), text_size=size.small, bgcolor=color.new(color.black, 60))
    table.cell(tbl, 0, 1, "Zone", text_color=txt_wht, text_size=size.small)
    table.cell(tbl, 1, 1, zone_lbl, text_color=zone_col, text_size=size.small)
    table.cell(tbl, 0, 2, "P(Bull)", text_color=txt_wht, text_size=size.small)
    table.cell(tbl, 1, 2, str.format("{0,number,#.#%}", post_bull), text_color=color.new(#2962FF, 0), text_size=size.small)
    table.cell(tbl, 0, 3, "P(Bear)", text_color=txt_wht, text_size=size.small)
    table.cell(tbl, 1, 3, str.format("{0,number,#.#%}", post_bear), text_color=color.new(#FF6D00, 0), text_size=size.small)
    table.cell(tbl, 0, 4, "N Trained", text_color=txt_wht, text_size=size.small)
    table.cell(tbl, 1, 4, str.tostring(int(trained_n)) + (warmed_up ? " ✓" : " …"), text_color=warmed_up ? color.new(color.lime, 0) : color.new(color.yellow, 0), text_size=size.small)
    table.cell(tbl, 0, 5, "─────", text_color=color.new(color.gray, 60), text_size=size.tiny)
    table.cell(tbl, 1, 5, "─────", text_color=color.new(color.gray, 60), text_size=size.tiny)
    table.cell(tbl, 0, 6, "● ▲ Long", text_color=color.new(#2962FF, 0), text_size=size.tiny)
    table.cell(tbl, 1, 6, "●=P≥85%", text_color=color.new(color.gray, 20), text_size=size.tiny)
    table.cell(tbl, 0, 7, "● ▼ Short", text_color=color.new(#FF6D00, 0), text_size=size.tiny)
    table.cell(tbl, 1, 7, "▲▼=normal", text_color=color.new(color.gray, 20), text_size=size.tiny)

// ── ALERTS ─────────────────────────────────────────────────────────────────
alertcondition(long_entry, "PD ML - Long", "Premium/Discount ML Zones [PickMyTrade]: Discount long — P(Bull) ≥ threshold")
alertcondition(short_entry, "PD ML - Short", "Premium/Discount ML Zones [PickMyTrade]: Premium short — P(Bear) ≥ threshold")
alertcondition(long_entry or short_entry, "PD ML - Any Signal", "Premium/Discount ML Zones [PickMyTrade]: Signal detected")