Author: Bhavishya Goyal | Published: June 6, 2026
Table of Contents
- The YouTube Shift — Why Are Traders Walking Away from ICT & SMC?
- What Does ICT & SMC Actually Get Right?
- What Is Real Order Flow? (Not the Buzzword Version)
- CVD — Cumulative Volume Delta
- Volume Profile
- Footprint Charts
- DOM — Depth of Market
- How Do You Use CVD in TradingView Right Now?
- What Makes the Institutional Order Flow Signals [PMT] Indicator Different?
- How Do You Build a Simple Order Flow Workflow?
- You May Also Like
- Frequently Asked Questions
- Is Order Flow actually better than ICT/SMC?
- Can I use Order Flow on TradingView for free?
- What is CVD divergence and why does it matter?
- Does the IOF Signals [PMT] indicator repaint?
- Does Order Flow work on crypto and forex?
- Citations
Key Takeaways
- ICT and SMC repackage Wyckoff theory, supply/demand, and support/resistance under new vocabulary — there is no empirically verifiable edge claim
- YouTube’s trading community began a visible pivot away from SMC educators in 2025, with order flow and volume analysis channels gaining audiences at a pace SMC content no longer matches
- Real order flow uses tick-level execution data (volume delta, footprint charts) — not candlestick shapes
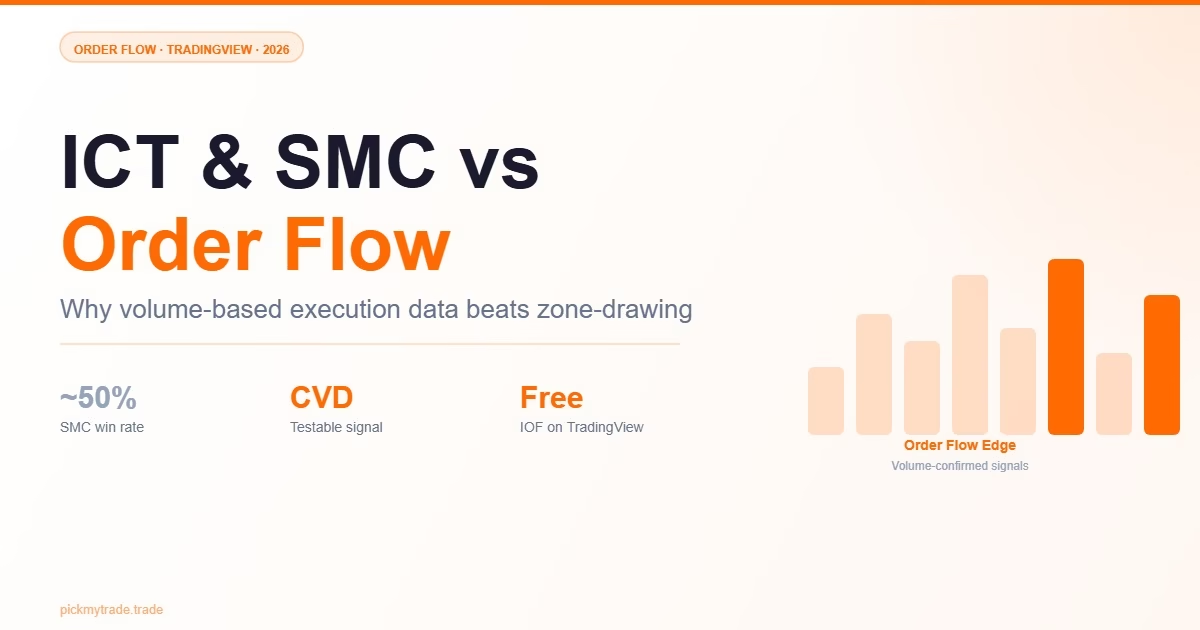
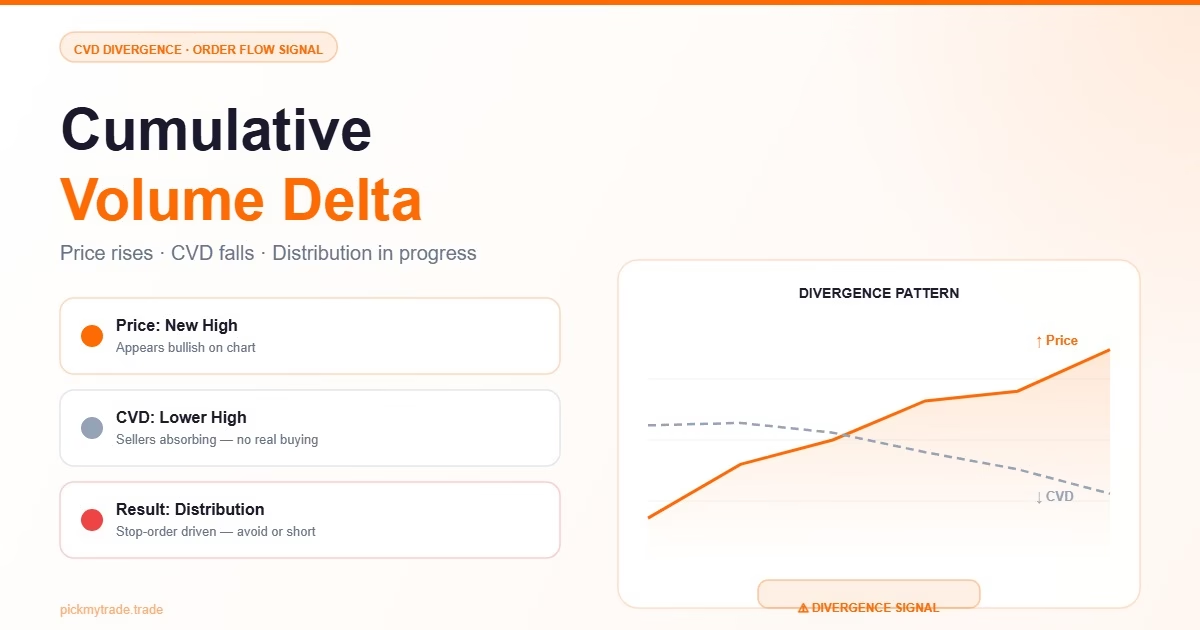
- CVD (Cumulative Volume Delta) shows aggressive buyer vs. seller imbalance in real time; a rising price with falling CVD is a provable distribution signal
- The free Institutional Order Flow Signals [PMT] indicator on TradingView runs CVD through a Naive Bayes classifier to generate probabilistic buy/sell signals — no subjective zone drawing required
The YouTube Shift — Why Are Traders Walking Away from ICT & SMC?
From 2022 through early 2025, YouTube trading content was almost entirely owned by two frameworks: ICT (Inner Circle Trader), the methodology built by Michael Huddleston, and SMC (Smart Money Concepts), the derivative system that hundreds of educators repackaged and resold.
The appeal was understandable. ICT offered a complete trading vocabulary — Fair Value Gaps (FVGs), Order Blocks, Breaker Blocks, Optimal Trade Entry (OTE), Kill Zones — paired with the narrative that you were finally trading in alignment with institutional algorithms. Educators built full courses around the same terms, and YouTube’s recommendation engine rewarded the format because traders kept watching, kept losing, and kept returning.
In 2025, the tone shifted. Forums, Discord servers, and comment sections started asking a question that had no satisfying ICT answer: why do my setups fail when I can identify the correct zone perfectly in hindsight every single time?
The answer is uncomfortable: you can fit a valid ICT or SMC pattern onto almost any chart after price has already moved. Order blocks appear at every major pivot. Fair Value Gaps exist in nearly every session. The framework correctly describes where price has been — it does not give you a statistically verifiable edge for predicting where price will go next.
“The shift from SMC to Order Flow represents a maturation in retail trading education. Frameworks built on subjective candlestick identification fail a basic test: their signals cannot be coded, backtested, and falsified. CVD divergence can. A Breaker Block cannot. Reproducibility is the minimum bar for calling something a trading edge.” — PickMyTrade Research, 2026
What Does ICT & SMC Actually Get Right?
Before moving on, it is worth identifying what these frameworks correctly describe — because the underlying market structure concepts are not wrong.
Both ICT and SMC describe liquidity dynamics: how price moves toward areas where stop orders cluster, sweeps those levels to trigger stops and fill institutional order flow, then reverses. This is real market behavior. It maps directly to Auction Market Theory and Wyckoff methodology, both of which have decades of documented use by professional traders.
Where the breakdown occurs:
The methodology relies entirely on candlestick-based zone identification:
- An “Order Block” is the last up-candle before a significant down-move (or vice versa) — the prior candle body used as a support/resistance zone
- A “Fair Value Gap” is a three-candle imbalance — a gap between candle 1’s wick and candle 3’s wick
- A “Liquidity Sweep” is a wick past a prior swing high or low that then reverses
None of these require volume data. You could apply every ICT concept to a synthetic price chart with completely random volume, and the zones would look identical to the real thing.
The core failure: A 50% pullback into an Order Block looks exactly the same whether institutional buyers are absorbing selling pressure (bullish) or institutional sellers are distributing into buying pressure (bearish). The candle shape does not distinguish between the two. The volume data does.
“Every SMC pattern can be identified in hindsight with apparent precision because the zone definitions are broad enough to match any significant candle near any significant move. This is not a trading edge — it is a visual pattern-matching exercise applied to completed data. The same bias that makes ICT boxes look convincing on past charts is the bias that makes them unreliable in real time.” — PickMyTrade Research, 2026
What Is Real Order Flow? (Not the Buzzword Version)
“Order Flow” has become as loosely applied as “Smart Money,” so here is the specific definition used by professional futures traders:
Order Flow = real-time tracking of executed buy and sell orders at specific price levels.
There are four primary tools:
CVD — Cumulative Volume Delta
CVD is the running total of (aggressive buy volume minus aggressive sell volume). An aggressive buy is a market order that hits the ask. An aggressive sell hits the bid.
What it tells you: Whether buyers or sellers are more aggressive. If price rises but CVD falls, large participants are selling into the rally — distribution. If price falls but CVD rises, buyers are absorbing selling pressure — accumulation.
Volume Profile
Volume Profile shows how much volume traded at each price level over a defined period. The Point of Control (POC) is the price with the most volume — a magnet price tends to return to. Low-volume nodes are prices where very little traded; price tends to move through them quickly.
Footprint Charts
Footprint charts show bid/ask volume inside each individual candle. At each price tick, you see exactly how many contracts traded on the bid versus the ask. This requires tick-level data from your broker and is available on Sierra Chart, Bookmap, and NinjaTrader.
DOM — Depth of Market
The DOM (order book) shows pending limit orders, not executed ones. Large bid clusters near current price indicate support; large ask clusters indicate resistance. DOM is real-time context — it changes constantly and is not a standalone signal.
“Volume Profile, CVD, and Footprint together form a three-layer view of the market: where volume concentrated historically (Profile), whether buyers or sellers won each period (CVD), and exactly what happened inside each bar (Footprint). No candlestick framework provides comparable objectivity or specificity at any of these three layers.” — PickMyTrade Research, 2026
How Do You Use CVD in TradingView Right Now?
TradingView does not provide tick-level bid/ask volume for most instruments. However, the high-low-close range approximation is the best free proxy and runs natively in Pine Script.
The formula used by the IOF Signals [PMT] indicator:
hl_range  = high - low + syminfo.mintick
bull_vol  = volume * (close - low)  / hl_range   // estimated buy volume
bear_vol  = volume * (high - close) / hl_range   // estimated sell volume
delta_bar = bull_vol - bear_vol
cvd      := cvd + delta_bar                       // cumulative sum
A bar closing at the high contributes 100% to buy volume. A bar closing at the low contributes 100% to sell volume. Anything between is proportional to where price closed within the range.
Three CVD setups to watch:
Setup 1 — CVD Divergence (Highest Probability)
Price makes a new swing high; CVD does not. The rally is losing genuine buyer backing — price is being driven by stop-order runs and momentum, not real institutional accumulation. This is the core order flow short trigger.
Setup 2 — CVD Momentum Confirmation
Price breaks above a key level and CVD accelerates upward at the same time. Both price action and execution flow confirm the move — a clean long setup without a single SMC box needed.
Setup 3 — CVD Slope Break
CVD had been trending in one direction, then the linear regression slope flattens and reverses before price itself moves. This is often the earliest signal that market regime is changing — visible in CVD before it appears on the price chart.
“CVD divergence is reproducible and testable: if price makes a new swing high and CVD is below its prior swing high, define that as a signal and run it across 1,000 occurrences. You cannot do this with a Breaker Block. Backtestability is not optional — it is what separates a method from a belief.” — PickMyTrade Research, 2026
What Makes the Institutional Order Flow Signals [PMT] Indicator Different?
The free Institutional Order Flow Signals [PMT] indicator on TradingView takes the CVD setups above and runs them through a probabilistic classifier instead of static thresholds.
Three Features — All CVD-Based, All Z-Score Normalised
| Feature | What It Measures |
|---|---|
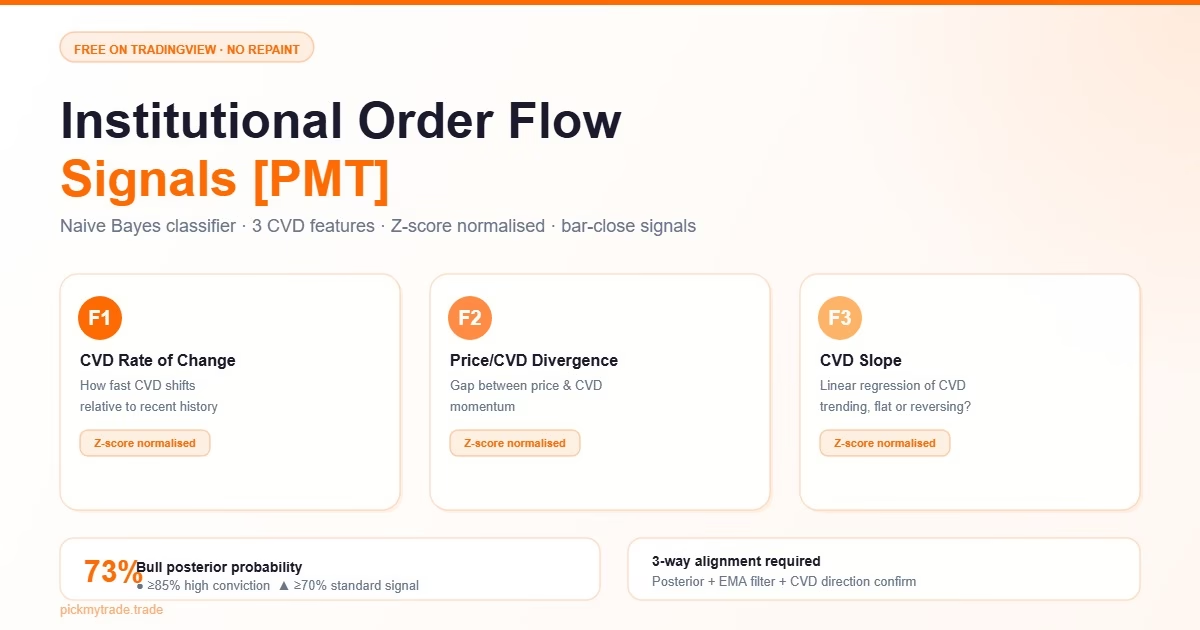
| F1 — CVD Rate of Change | How fast CVD is changing relative to its recent history (z-scored over the lookback window) |
| F2 — Price/CVD Divergence | The gap between price momentum and CVD momentum — detects distribution and accumulation in real time |
| F3 — CVD Slope | Linear regression slope of CVD — is it trending, flat, or reversing? |
All three features are z-score normalised, which means the same settings work across different instruments and timeframes without manual recalibration.
The Naive Bayes Classifier
Rather than triggering signals at fixed thresholds, the indicator trains on recent bars — default 100. It learns: when all three CVD features looked like this in the past, what percentage of the time did price go up versus down?
It outputs a probability. Post_Bull = 73% means “given current order flow conditions, price went up 73% of the time in similar situations on this chart over the last 100 bars.”
A signal fires only when all three conditions align simultaneously:
- Posterior probability ≥ your entry threshold (default 70%)
- Price is on the correct side of the 50-period EMA (trend filter)
- CVD direction confirms (CVD rising for longs, falling for shorts)
Confidence Tiers Shown on Chart
- ● (circle) = high conviction, posterior ≥ 85%
- ▲ / ▼ (triangle) = normal conviction, posterior ≥ threshold
The info table in the top-right corner shows live Bull and Bear posterior probabilities, CVD flow direction, and training sample count — so you always know whether the classifier has enough data to trust.
“The IOF Signals [PMT] indicator is designed to give traders one number ICT cannot produce: a probability estimate grounded in recent volume data. Knowing that current CVD conditions historically resolved bullishly 78% of the time on this instrument is actionable information. Knowing that price is inside an Order Block is not — without volume context, the zone resolves randomly.” — PickMyTrade Research, 2026
How Do You Build a Simple Order Flow Workflow?
Three steps — replacing the typical ICT sequence:
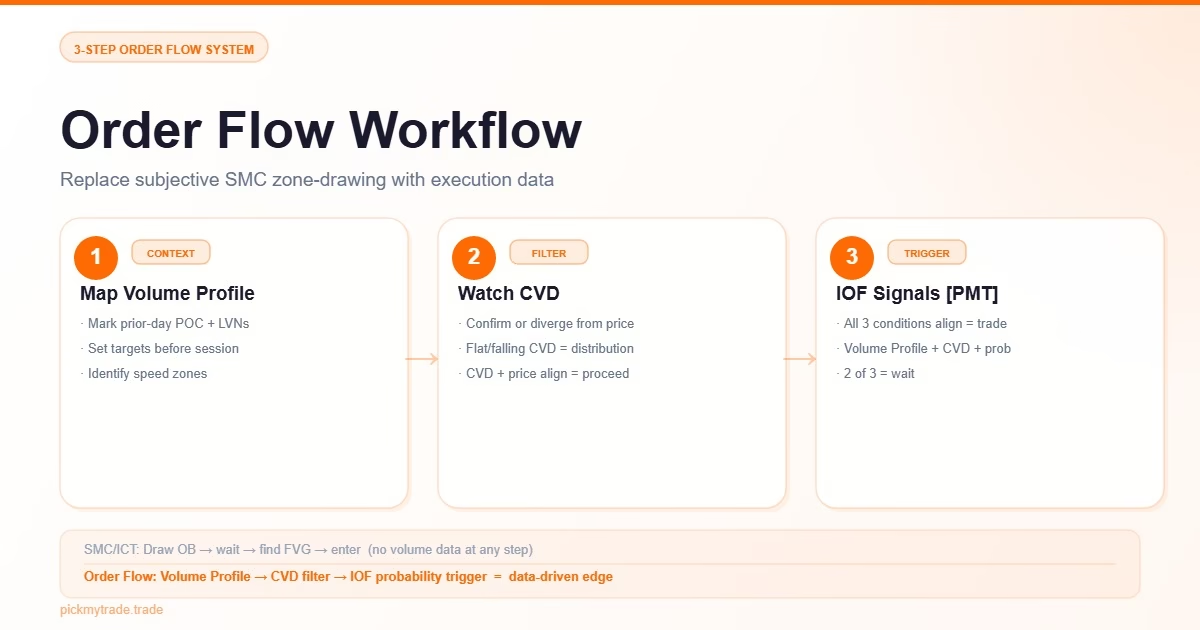
Step 1 — Map the Volume Profile (Context)
Before the session opens, mark the prior day’s POC (Point of Control) and note visible low-volume nodes above and below current price. These are your targets and speed zones. Price moves through low-volume nodes fast; it spends time near high-volume nodes.
Step 2 — Watch CVD for Divergence or Confirmation (Filter)
During the session, watch whether CVD confirms or diverges from price. If price is rallying toward a prior high and CVD is flat or falling, that is a distribution warning — sellers are active. If price pulls back and CVD holds above its prior swing low, buyers are still in control.
Step 3 — Use IOF Signals [PMT] for Timing (Trigger)
Add the IOF Signals [PMT] indicator. When a ● or ▲/▼ fires, check whether it aligns with the Volume Profile context from Step 1 and the CVD read from Step 2. All three confirming = take the trade. Two out of three = wait.
Compare to the typical SMC process:
- Draw Order Block on the chart
- Wait for price to return to it
- Find an FVG inside the OB as “confirmation”
- Enter when price wicks the zone
The SMC workflow has no volume component at any step. You could watch distribution happening in real time through CVD, and the candlestick pattern inside the box still looks perfect right up until the stop gets hit.
You May Also Like
- Umar Ashraf Power of Three Strategy — PickMyTrade — How PO3 combines SMC-style market structure with volume confirmation for a structured daily bias and automated execution
- TradingView MCP with Claude AI — Setup Guide — Use AI to write and test Pine Script indicators including CVD-based strategies in minutes
- Best TradingView Automation Platforms in 2026 — Connect Order Flow signals from IOF Signals [PMT] to automated execution on Tradovate, Binance, and Bybit
Frequently Asked Questions
Is Order Flow actually better than ICT/SMC?
For traders who want a data-driven, testable approach: yes. CVD, Volume Profile, and Footprint produce signals that can be systematically backtested and falsified. ICT and SMC patterns rely on subjective zone identification that resists systematic testing. Both describe similar market dynamics — Order Flow gives you the execution data that ICT assumes without checking.
Can I use Order Flow on TradingView for free?
Yes. TradingView’s free plan includes volume bars and Pine Script access. The hl-range CVD approximation runs entirely in Pine Script with no paid data required. The IOF Signals [PMT] indicator is free and published openly on TradingView. True Footprint Charts require tick-level data from a paid provider (Sierra Chart, Bookmap, or NinjaTrader).
What is CVD divergence and why does it matter?
CVD divergence occurs when price makes a new swing high (or low) but Cumulative Volume Delta does not confirm it. This means the price move was driven by stop-order runs or passive momentum — not genuine aggressive buying or selling. Divergence between price action and execution data is one of the highest-probability short-term reversal setups in order flow trading.
Does the IOF Signals [PMT] indicator repaint?
No. Signals are generated on bar close. The Naive Bayes classifier uses lagged feature values (f1[1], f2[1], f3[1]) — no current-bar data is used in training. The entry condition requires the signal to be true on the current bar and false on the prior bar, which fires after conditions are first met. Closed bars do not change.
Does Order Flow work on crypto and forex?
CVD and Volume Profile work reliably on assets with centralized, exchange-reported volume — crypto on major centralized exchanges (Binance, Bybit, CME Bitcoin futures) and equity futures. Traditional spot forex has no centralized volume reporting, so CVD approximations are less reliable for FX pairs. CME FX futures have trustworthy volume data.
Citations
- James Dalton — Mind Over Markets: Power Trading with Market Generated Information (2013) — foundational reference for Auction Market Theory and Volume Profile
- CME Group Education — Understanding Market Profile — CME Group, 2024
- Jigsaw Trading — What Is Order Flow Trading? — Jigsaw Trading Education, 2025
- Bookmap — Volume Delta and CVD Explained — Bookmap Knowledge Base, 2025
- TradingView — Pine Script v6 Reference Manual — TradingView, 2025
- PickMyTrade — Institutional Order Flow Signals [PMT] — TradingView Script Library, 2025
- CFTC — Commitments of Traders Reports — CFTC.gov
- Sierra Chart — Volume at Price and Market Profile Documentation — Sierra Chart, 2025
Ready to automate your Order Flow signals? Connect the IOF Signals [PMT] indicator to PickMyTrade and execute trades on Tradovate futures directly from your TradingView alerts — no manual order entry, no missed signals.