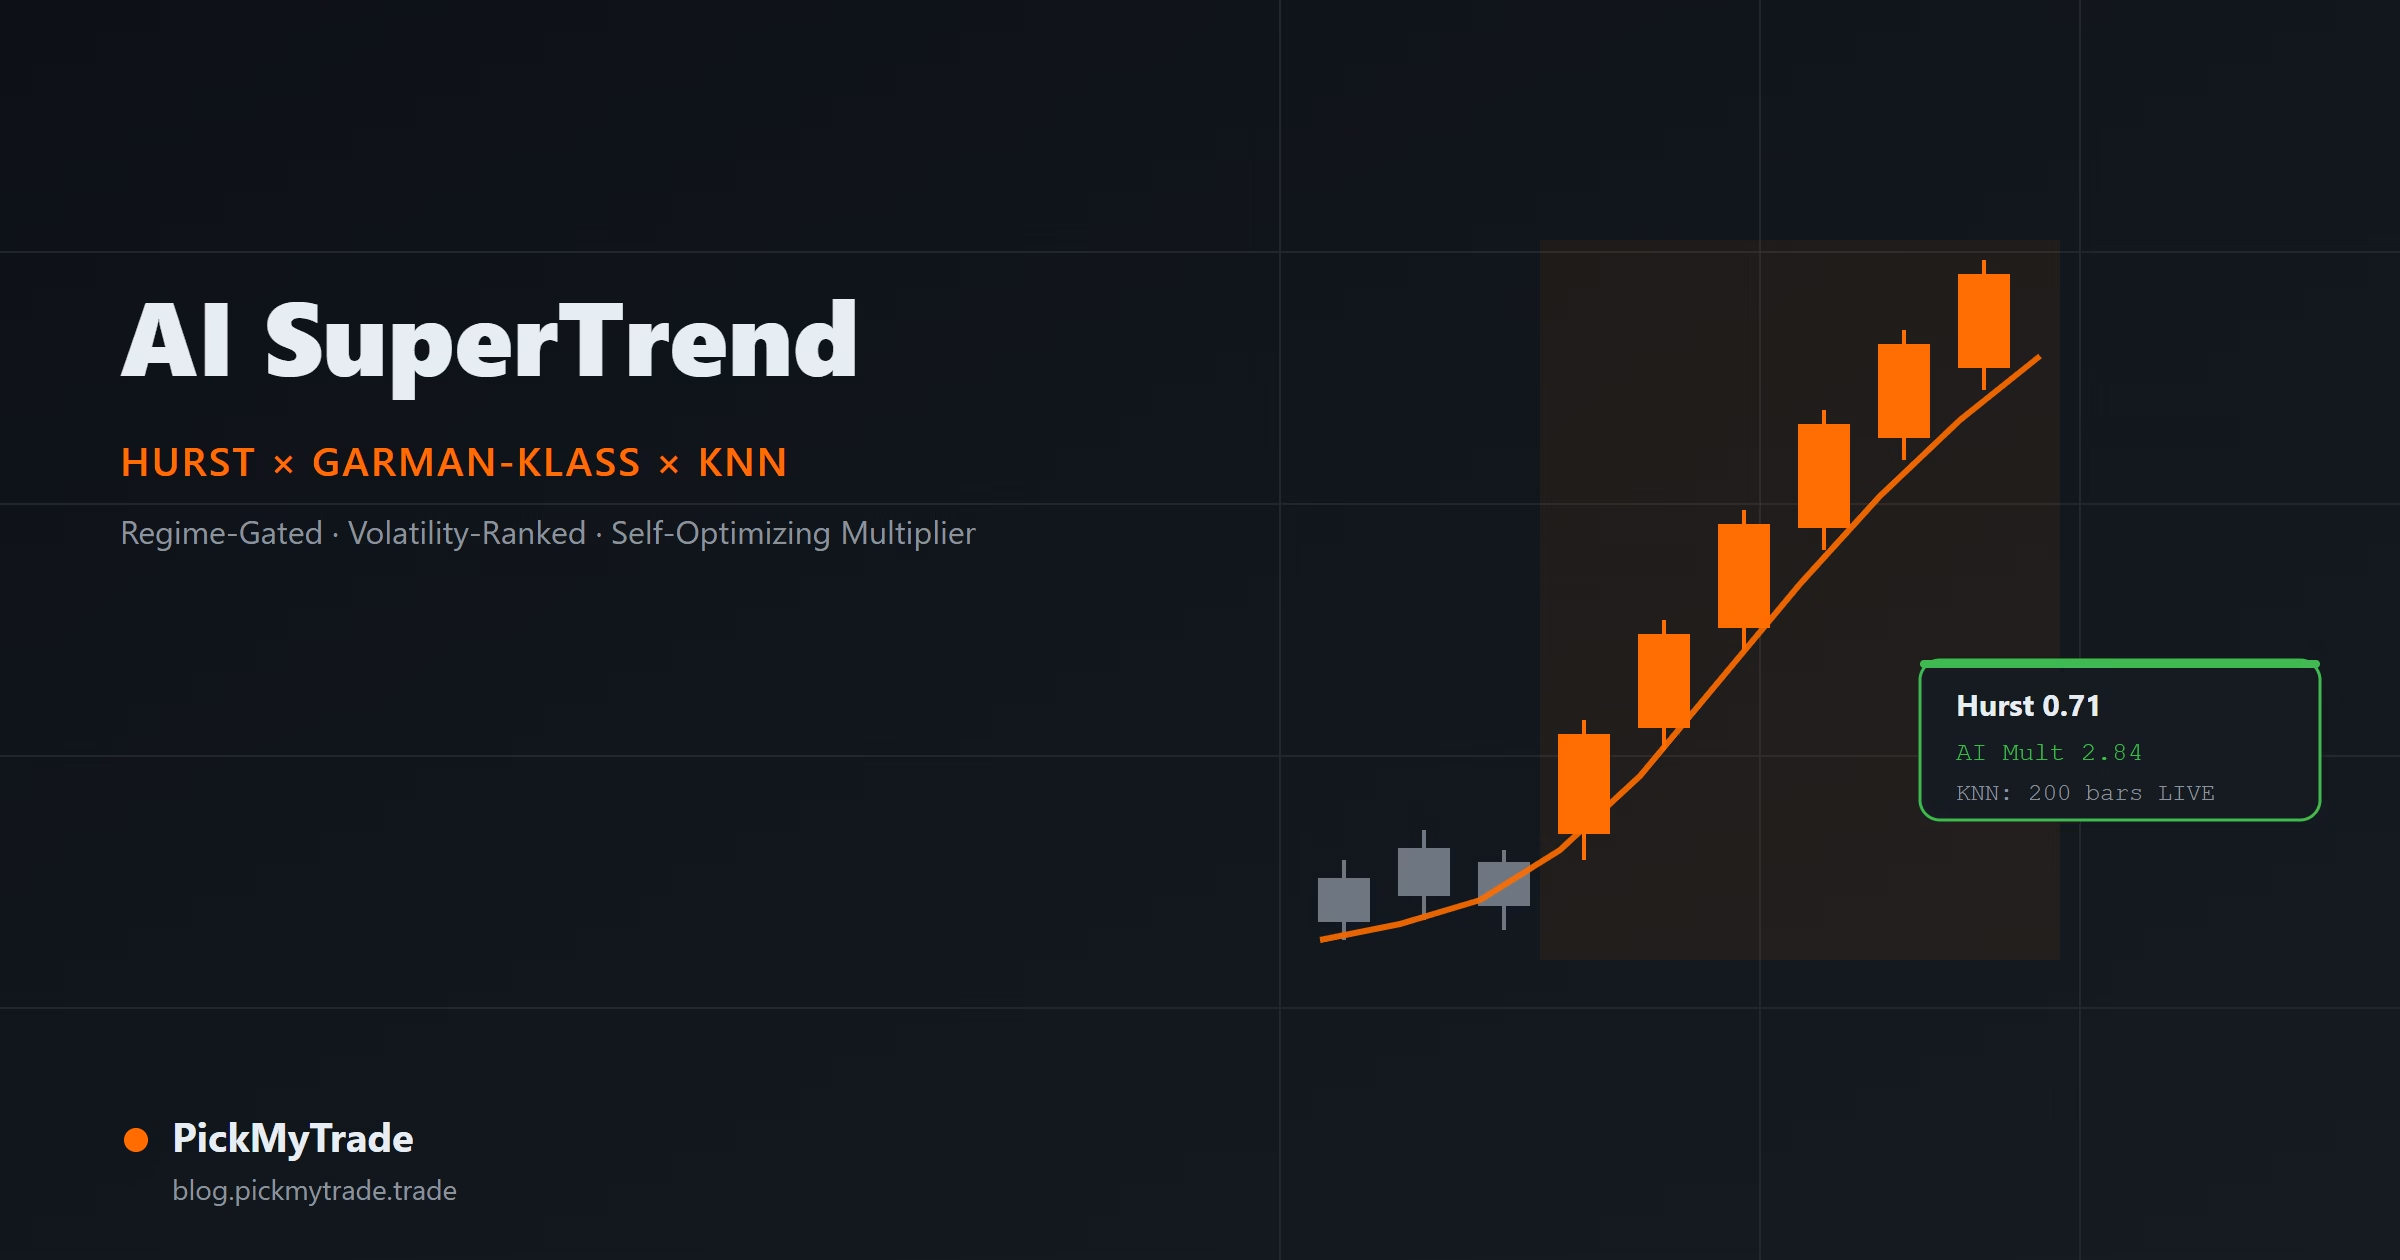
Every classic SuperTrend runs on one constant: an ATR multiplier you set once and it applies everywhere. AI SuperTrend [PickMyTrade] replaces that constant with three stacked AI layers, a Hurst Exponent regime gate, a Garman-Klass volatility rank, and a K-Nearest Neighbors engine, that recompute the multiplier fresh on every bar from what actually worked the last time the market looked like this.
Table of Contents
- Why Does a Fixed ATR Multiplier Break Down in Choppy Markets?
- How Does the Hurst Exponent Decide When AI SuperTrend Should Trade?
- What Does Garman-Klass Volatility Rank Add to the Model?
- How Does the KNN Multiplier Optimizer Pick a Value?
- How Is the SuperTrend Line Plotted from the AI Multiplier?
- What Do the Hurst-Colored Candles and Signals Mean?
- How Do You Use AI SuperTrend to Trade?
- How Do You Automate AI SuperTrend Signals with PickMyTrade?
- What Are AI SuperTrend’s Limitations?
- Full Pine Script Source
- You May Also Like
- Frequently Asked Questions
- Does AI SuperTrend repaint?
- What’s the actual difference between AI SuperTrend and a standard SuperTrend?
- How long does the KNN engine need to warm up?
- Can I use AI SuperTrend on any market or timeframe?
- Do I need a paid TradingView plan to use it?
Key Takeaways
Markets spend roughly 20–30% of their time trending, with the remaining 60–80% in ranging or choppy conditions, according to trader-education research on market regimes (LuxAlgo). A fixed-multiplier trend indicator is, by definition, mistuned for most of that time.
Why Does a Fixed ATR Multiplier Break Down in Choppy Markets?
The failure mode is well documented: every SuperTrend flip in a range costs the ATR-multiple distance the band trails behind price, and in choppy weeks, price can cross that band repeatedly within a tight range, producing a sequence of flips that bleed the account one whipsaw at a time (CrossTrade). Lower the multiplier and the band tracks price tighter, catching trends earlier but triggering more false flips in chop; raise it and noise gets filtered at the cost of later entries and larger giveback before each flip confirms (TrendSpider).
The standard fix traders reach for is a manual regime filter, commonly ADX above 20, or switching to a higher timeframe to judge trend before trusting the flip. AI SuperTrend automates that judgment call and makes it continuous instead of binary: rather than an on/off ADX gate, every bar gets its own regime-appropriate multiplier, sized from bars that actually looked like it.
AI SuperTrend isn’t the only script attacking this problem. TradingView’s own library includes k-means clustering approaches like AlgoAlpha’s Machine Learning Adaptive SuperTrend and LuxAlgo’s SuperTrend AI (Clustering), both of which group recent volatility into discrete clusters to pick a multiplier. AI SuperTrend takes a different path: instead of clustering volatility alone, it gates on trend persistence first (Hurst) and only then searches historical analogs (KNN) for the multiplier, so a bar can be volatile and still get no signal if the Hurst reading says the market isn’t actually trending.
How Does the Hurst Exponent Decide When AI SuperTrend Should Trade?
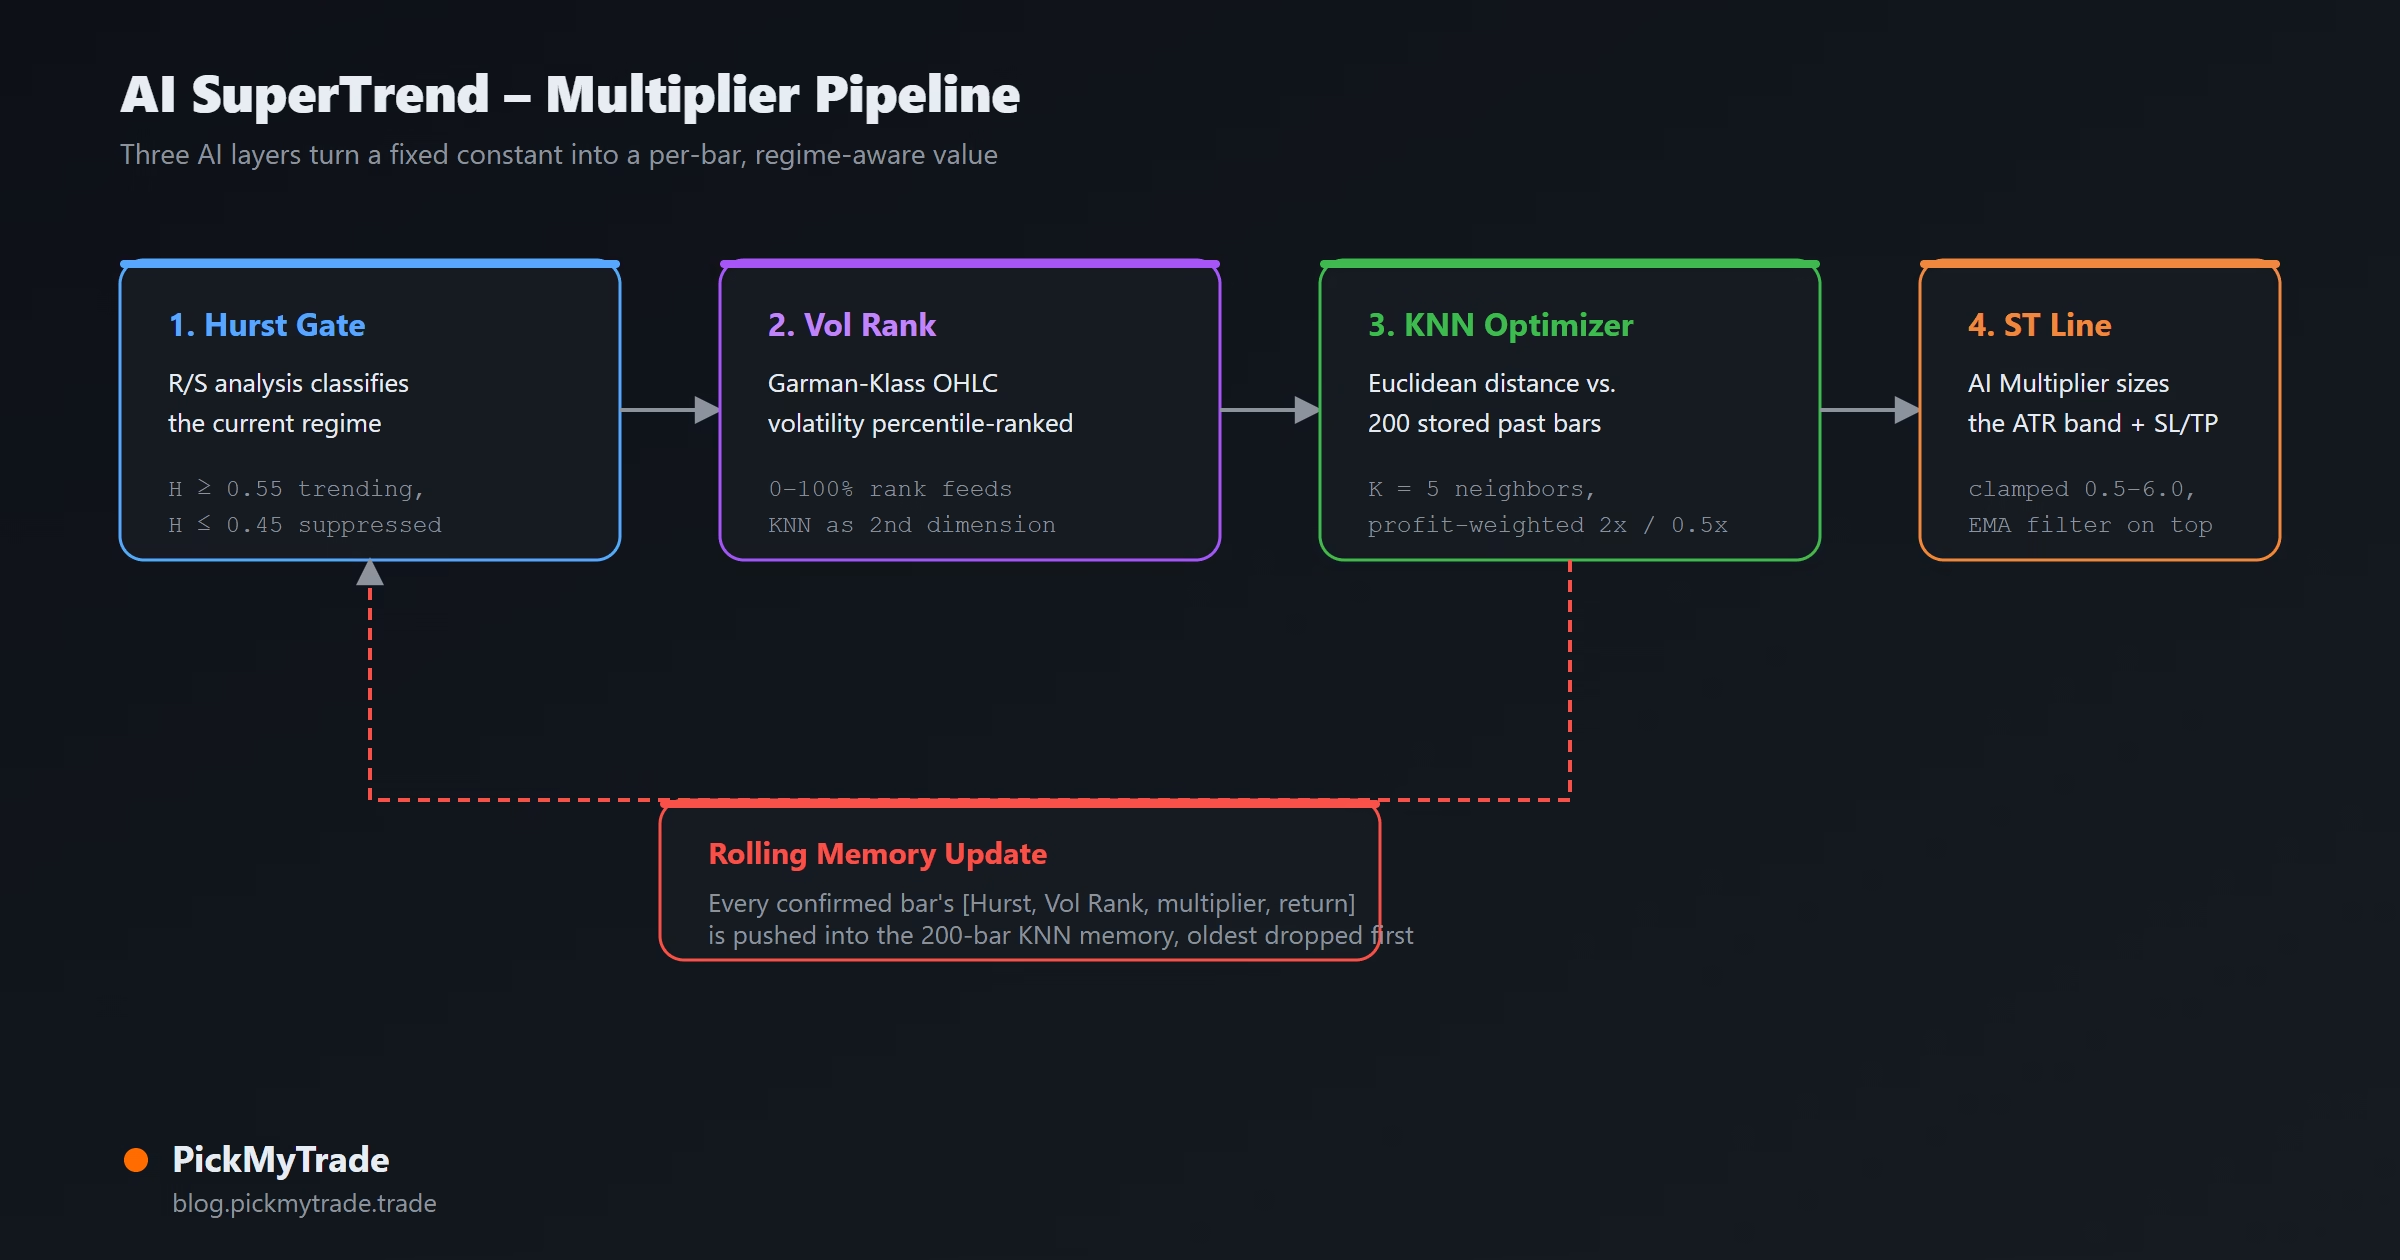
Layer 1 is a Hurst Exponent computed via Rescaled Range (R/S) Analysis, a method Harold Hurst introduced in 1951 to measure long-range dependence, or memory, in a time series. R/S analysis looks at how the range of cumulative deviations from the mean scales as the observation window grows; the resulting exponent classifies the series as persistent, anti-persistent, or a random walk (arXiv: Hurst exponent estimators in long-range dependent time series).
H ≥ 0.55  →  Persistent (trending)      — SuperTrend active, signals enabled
H ≈ 0.50  →  Random walk                — candles turn gray, no signal
H ≤ 0.45  →  Anti-persistent (mean-rev) — signals suppressed
That gate runs before anything else in the signal chain. A trend flip that would have printed a signal on a standard SuperTrend gets silently dropped if the Hurst reading says the market isn’t in a persistence regime, which is the mechanism actually responsible for cutting down chop-driven whipsaws, not a slower moving average or a wider band.
What Does Garman-Klass Volatility Rank Add to the Model?
Layer 2 estimates realized volatility using the Garman-Klass estimator, which draws on the open, high, low, and close of each bar rather than close-to-close returns alone, making it more sensitive to intrabar range and, according to the original research, more statistically efficient than a simple close-to-close variance estimate over the same observation window (Garman, M. & Klass, M., 1980. On the Estimation of Security Price Volatilities from Historical Data. Journal of Business, 53(1), 67–78).
The script ranks the current Garman-Klass reading as a percentile (0–100%) against its recent history and feeds that rank into the KNN engine as the second feature dimension, alongside the Hurst value. It also scales the base ATR multiplier directly: _vol_scale = 1.0 + (vol_rank / 100.0) * 0.4, so a bar sitting in the 100th percentile of recent volatility gets up to 40% more multiplier headroom before the KNN layer even runs.
How Does the KNN Multiplier Optimizer Pick a Value?
Layer 3 is where the first two layers become an actual number. On every confirmed bar, AI SuperTrend stores the prior bar’s [Hurst, Vol Rank, base multiplier, forward return] into a rolling memory array capped at the KNN Memory input (default 200 bars). Once that memory holds at least K entries (default 5), the engine measures Euclidean distance between the current [Hurst, Vol Rank] pair and every stored historical pair, sorts by distance, and keeps the K closest matches.
Each of those K neighbors contributes its historical ATR multiplier to a weighted average, weighted twice as heavily if the bar that followed it moved in a profitable direction and only half as heavily if it didn’t. The result, clamped between 0.5 and 6.0, becomes the live AI Multiplier, a value pulled from the historical bars that most resembled right now, not a number typed into a settings panel once and forgotten.
K-Nearest Neighbors is a common building block in retail algorithmic trading precisely because it makes no distributional assumptions about the underlying data and adapts naturally to local structure in the feature space, though its accuracy is sensitive to how informative the chosen features are (Medium/FMZ: KNN Trend Prediction Trading System). Here the features are Hurst and volatility rank specifically because both are regime descriptors, not price levels, so the match is about market condition, not price level.
All three layers, Hurst regime detection, Garman-Klass volatility, and the KNN multiplier search, are implemented in PickMyTradeLib, an internal Pine Script library shared across PickMyTrade’s indicator suite (the same library backing signal-scoring logic in Order Block AI), rather than copy-pasted inline math unique to this one script.
How Is the SuperTrend Line Plotted from the AI Multiplier?
Once the AI Multiplier is set, the rest is standard SuperTrend mechanics, just recalculated with a variable input instead of a constant. Upper and lower bands are built from hl2 ± ai_mult * ATR, each band only moves in the direction that tightens around price (never loosens against the current trend), and direction flips when price closes through the opposite band. The result is a single adaptive trailing line, tagged Option B in this build specifically because it renders as one line plus regime-colored candles rather than a filled cloud, which keeps the chart legible when multiple confirmation layers are already stacked on top.
A 50-period EMA runs alongside the SuperTrend line as a secondary trend filter: long signals require price above the EMA, short signals require price below it, on top of the Hurst and direction-flip conditions already gating the signal.
What Do the Hurst-Colored Candles and Signals Mean?
The defining visual choice in this build is that candle color reflects the Hurst regime, not just SuperTrend direction. Orange candles mean a confirmed bullish trending regime, blue candles mean a confirmed bearish trending regime, and gray candles mean the market has fallen into a random walk or mean-reverting state, readable on every single bar without opening the input panel or checking the info table.
Signal markers carry the same regime logic. A circle marks a trend flip where the Hurst reading has cleared 0.65, a higher bar than the 0.55 entry threshold, reserved for the highest-conviction persistence readings; a triangle marks a flip at the standard threshold. No marker of either kind appears on a gray candle, because the Hurst gate has already suppressed the signal upstream. Dashed stop-loss and take-profit lines draw automatically at each signal bar, sized from the ATR and the AI Multiplier active at that moment, and a top-right info table shows the live Hurst value, regime label, direction, AI Multiplier, volatility rank, and how many bars the KNN memory currently holds, including a WARMUP flag before that memory reaches the minimum K count.
How Do You Use AI SuperTrend to Trade?
A signal requires three conditions at once, and dropping any one of them is why a flip on the raw SuperTrend line doesn’t always produce a marker on the chart:
- KNN is warmed up: the info table reads ● LIVE, meaning the memory bank holds at least K historical bars to search.
- Hurst confirms a trending regime: the current reading is at or above the Trend Threshold input (0.55 by default).
- Price is on the correct side of the EMA filter: above it for longs, below it for shorts.
Circle signals, where Hurst has cleared 0.65, represent the strongest persistence readings the model currently sees and are the highest-conviction subset of the signal stream. Gray candles are the model’s way of saying stand aside: reduced size or no new entries is the more defensible read during those periods, since the regime gate has already determined the current structure doesn’t favor trend-following.
How Do You Automate AI SuperTrend Signals with PickMyTrade?
The script ships three alertcondition() triggers, Long, Short, and Any Signal, each firing only after all three gate conditions above are satisfied on a confirmed bar. Wiring any of them into a TradingView alert with a webhook produces the same JSON payload PickMyTrade uses across its indicator suite, so a Hurst-gated, KNN-optimized long or short signal routes straight to a live order without anyone watching the chart to catch the flip manually.
Ready to turn regime-gated signals into executed trades? Connect AI SuperTrend to pickmytrade.trade for Tradovate futures. No manual order entry, no missed flips while you’re away from the chart.
What Are AI SuperTrend’s Limitations?
The KNN layer needs its full memory window (default 200 bars) before the AI Multiplier activates; until then, the script falls back to the Hurst- and volatility-scaled base multiplier alone, which is still adaptive but hasn’t yet benefited from historical pattern matching. Garman-Klass volatility, like any OHLC-based estimator, assumes the open approximates the prior close, so it can understate volatility around large overnight gaps, a known limitation of the method rather than an implementation bug (Garman & Klass, 1980). And because the KNN memory bank only holds a rolling 200 bars, the model reflects recent regime history, not the full range of conditions an instrument has ever traded through, so a genuinely unprecedented regime shift (a new all-time volatility record, for instance) has no close historical analog to match against.
None of that replaces position sizing or a stop-loss discipline independent of the indicator. The Risk:Reward and SL ATR Multiplier inputs size the plotted levels; whether those levels match a trader’s actual risk tolerance per trade is still a decision the indicator doesn’t make.
For context on what “adaptive” SuperTrend variants can realistically deliver: one third-party review of ML-multiplier SuperTrend builds reported a 62% win rate on 1-hour ES futures over a two-year backtest window (Lunefi), a useful ballpark for what regime-aware trend-following can achieve, not a guarantee any specific configuration repeats it going forward.
Full Pine Script Source
The complete v6 source for AI SuperTrend [PickMyTrade], exactly as published on TradingView. Copy it into Pine Editor, or add the indicator directly from the TradingView script page. Note it imports PickMyTrade_Official/PickMyTradeLib/1, PickMyTrade’s shared Pine Script library, so the Hurst and Garman-Klass functions won’t resolve if copied without that import.
// This Pine Script® code is subject to the terms of the Mozilla Public License 2.0
// © PickMyTrade — AI SuperTrend [PickMyTrade] — Option B: Hurst-Colored Candles

//@version=6
import PickMyTrade_Official/PickMyTradeLib/1 as pmtq

indicator(
    title            = "AI SuperTrend [PickMyTrade]",
    shorttitle       = "AIST [PMT]",
    overlay          = true,
    max_labels_count = 50,
    max_lines_count  = 50
)

var string G_AI   = "AI Engine"
var string G_CORE = "SuperTrend"
var string G_VIS  = "Visual"
var string G_ZEN  = "Display"

i_hurst_len   = input.int  (60,   "Hurst Lookback",        minval=30,  maxval=200, step=5,  group=G_AI, tooltip="Bars used for R/S analysis. 60 recommended.")
i_knn_k       = input.int  (5,    "KNN Neighbors (K)",     minval=3,   maxval=15,           group=G_AI, tooltip="Historical analogs matched per bar.")
i_knn_depth   = input.int  (200,  "KNN Memory (bars)",     minval=50,  maxval=500, step=25, group=G_AI, tooltip="Bars stored in KNN memory bank.")
i_hurst_trend = input.float(0.55, "Trend Threshold",       minval=0.50, maxval=0.80, step=0.01, group=G_AI, tooltip="Hurst ≥ this = trending regime.")
i_hurst_pause = input.float(0.45, "Mean-Revert Threshold", minval=0.30, maxval=0.50, step=0.01, group=G_AI, tooltip="Hurst ≤ this = mean-reverting. Signals suppressed.")

i_atr_len   = input.int  (14,  "ATR Length",       minval=5,   maxval=50,            group=G_CORE, tooltip="ATR period for SuperTrend.")
i_base_mult = input.float(2.5, "Base Multiplier",  minval=0.5, maxval=6.0, step=0.1, group=G_CORE, tooltip="Base ATR multiplier. AI scales this each bar.")
i_vol_len   = input.int  (20,  "Vol Window",       minval=10,  maxval=100,           group=G_CORE, tooltip="Garman-Klass volatility window.")
i_ema_len   = input.int  (50,  "Trend EMA Period", minval=5,   maxval=500,           group=G_CORE, tooltip="Trend filter. Longs above, shorts below.")

bull_col    = input.color(color.new(#FF6D00, 0), "Bull Colour",   group=G_VIS)
bear_col    = input.color(color.new(#2962FF, 0), "Bear Colour",   group=G_VIS)
show_levels = input.bool (true,  "Show SL / TP Lines", group=G_VIS)
sl_mult     = input.float(1.5,  "SL ATR Multiplier",  minval=0.5, maxval=5.0,  step=0.1, group=G_VIS, active=show_levels)
rr_ratio    = input.float(2.0,  "Risk : Reward",      minval=0.5, maxval=10.0, step=0.1, group=G_VIS, active=show_levels)
show_bg     = input.bool (true,  "Regime Background",  group=G_VIS)
zen_mode    = input.bool (false, "Zen Mode",           group=G_ZEN, tooltip="Hides labels and table.")
show_table  = input.bool (true,  "Show Info Table",    group=G_ZEN)

float hurst    = pmtq.hurstRS(close, i_hurst_len)
float vol_rank = pmtq.garmanKlass(open, high, low, close, i_vol_len).rank

float _hurst_scale  = 1.0 + (0.5 - math.max(0.0, math.min(1.0, hurst))) * 1.6
float _vol_scale    = 1.0 + (vol_rank / 100.0) * 0.4
float base_adaptive = i_base_mult * _hurst_scale * _vol_scale

var array<float> _knn_h   = array.new<float>()
var array<float> _knn_v   = array.new<float>()
var array<float> _knn_m   = array.new<float>()
var array<float> _knn_ret = array.new<float>()

if barstate.isconfirmed and bar_index > i_hurst_len + 1
    float _ret_prev = (close - close[1]) / math.max(close[1], 1e-10)
    array.push(_knn_h,   hurst[1])
    array.push(_knn_v,   vol_rank[1])
    array.push(_knn_m,   base_adaptive[1])
    array.push(_knn_ret, _ret_prev)
    if array.size(_knn_h) > i_knn_depth
        array.shift(_knn_h)
        array.shift(_knn_v)
        array.shift(_knn_m)
        array.shift(_knn_ret)

float ai_mult = base_adaptive
int   _n      = array.size(_knn_h)
bool  warmed  = _n >= i_knn_k

if warmed
    array<float> _dists = array.new<float>(_n)
    for _i = 0 to _n - 1
        float _dh = (hurst    - array.get(_knn_h, _i)) / 0.5
        float _dv = (vol_rank - array.get(_knn_v, _i)) / 100.0
        array.set(_dists, _i, _dh * _dh + _dv * _dv)
    array<float> _sorted = array.copy(_dists)
    array.sort(_sorted, order.ascending)
    float _kth = array.get(_sorted, math.min(i_knn_k - 1, _n - 1))
    float _sw = 0.0
    float _sm = 0.0
    for _i = 0 to _n - 1
        float _d = array.get(_dists, _i)
        if _d <= _kth + 1e-10
            float _r = array.get(_knn_ret, _i)
            float _w = (_r > 0.0 ? 2.0 : 0.5) / (_d + 1e-6)
            _sw += _w
            _sm += _w * array.get(_knn_m, _i)
    if _sw > 1e-10
        ai_mult := math.max(0.5, math.min(6.0, _sm / _sw))

// ── B: SINGLE LINE + HURST-COLORED CANDLES ───────────────────────────────────
float _atr    = ta.atr(i_atr_len)
float _up_raw = hl2 + ai_mult * _atr
float _dn_raw = hl2 - ai_mult * _atr

var float _up  = na
var float _dn  = na
var int   _dir = 1

_up  := na(_up[1]) or _up_raw < _up[1] or close[1] > _up[1] ? _up_raw : _up[1]
_dn  := na(_dn[1]) or _dn_raw > _dn[1] or close[1] < _dn[1] ? _dn_raw : _dn[1]
_dir := nz(_dir[1], 1) == -1 and close > _up[1] ? 1 : nz(_dir[1], 1) == 1 and close < _dn[1] ? -1 : nz(_dir[1], 1)

float st_line  = _dir == 1 ? _dn : _up
float ema_line = ta.ema(close, i_ema_len)
bool  above_ema = close > ema_line
bool  below_ema = close < ema_line

bool regime_trend = hurst >= i_hurst_trend
bool regime_pause = hurst <= i_hurst_pause
bool bull_flip = _dir == 1  and nz(_dir[1], 1) == -1
bool bear_flip = _dir == -1 and nz(_dir[1], 1) ==  1
bool long_sig  = warmed and bull_flip and regime_trend and above_ema
bool short_sig = warmed and bear_flip and regime_trend and below_ema
bool long_hi   = long_sig  and hurst >= 0.65
bool short_hi  = short_sig and hurst >= 0.65

color _st_col = regime_pause ? color.new(color.gray, 30) : _dir == 1 ? color.new(bull_col, 0) : color.new(bear_col, 0)

plot(ema_line, "EMA",          color=color.new(color.gray, 60), linewidth=1)
plot(st_line,  "AI SuperTrend", color=_st_col, linewidth=2)

// Hurst-colored candles — the defining visual of Option B
barcolor(regime_trend and _dir == 1  ? color.new(bull_col, 15) : regime_trend and _dir == -1 ? color.new(bear_col, 15) : regime_pause ? color.new(color.gray, 35) : na, title="Regime Candles")

plotshape(long_hi  and not zen_mode, "Long ● High",   location=location.belowbar, style=shape.circle,      size=size.small, color=color.new(bull_col, 0))
plotshape(long_sig and not long_hi  and not zen_mode, "Long ▲",  location=location.belowbar, style=shape.triangleup,   size=size.small, color=color.new(bull_col, 0))
plotshape(short_hi and not zen_mode, "Short ● High",  location=location.abovebar, style=shape.circle,      size=size.small, color=color.new(bear_col, 0))
plotshape(short_sig and not short_hi and not zen_mode, "Short ▼", location=location.abovebar, style=shape.triangledown, size=size.small, color=color.new(bear_col, 0))

bgcolor(show_bg and regime_trend and _dir == 1  ? color.new(bull_col, 93) : na, title="Bull Regime")
bgcolor(show_bg and regime_trend and _dir == -1 ? color.new(bear_col, 93) : na, title="Bear Regime")

var line sl_line = na
var line tp_line = na
if long_sig and show_levels and not zen_mode
    sl_line := line.new(bar_index, close - _atr * sl_mult, bar_index + 8, close - _atr * sl_mult, color=color.new(color.red, 30), width=1, style=line.style_dashed)
    tp_line := line.new(bar_index, close + _atr * sl_mult * rr_ratio, bar_index + 8, close + _atr * sl_mult * rr_ratio, color=color.new(color.green, 30), width=1, style=line.style_dashed)
if short_sig and show_levels and not zen_mode
    sl_line := line.new(bar_index, close + _atr * sl_mult, bar_index + 8, close + _atr * sl_mult, color=color.new(color.red, 30), width=1, style=line.style_dashed)
    tp_line := line.new(bar_index, close - _atr * sl_mult * rr_ratio, bar_index + 8, close - _atr * sl_mult * rr_ratio, color=color.new(color.green, 30), width=1, style=line.style_dashed)

var table tbl = table.new(position.top_right, 2, 9, bgcolor=color.new(color.black, 75), border_color=color.new(color.gray, 60), border_width=1, frame_color=color.new(color.gray, 50), frame_width=1)
if barstate.islast and show_table
    color txt_wht = color.new(color.white, 0)
    table.cell(tbl, 0, 0, "AI SuperTrend", text_color=color.new(color.gray, 0), text_size=size.small, bgcolor=color.new(color.black, 60))
    table.cell(tbl, 1, 0, warmed ? "● LIVE" : "● WARMUP", text_color=warmed ? color.new(color.lime, 0) : color.new(color.yellow, 0), text_size=size.small, bgcolor=color.new(color.black, 60))
    table.cell(tbl, 0, 1, "Hurst",     text_color=txt_wht, text_size=size.small)
    table.cell(tbl, 1, 1, str.tostring(hurst, "#.###"), text_color=regime_trend ? color.new(bull_col, 0) : regime_pause ? color.new(bear_col, 0) : color.new(color.gray, 0), text_size=size.small)
    table.cell(tbl, 0, 2, "Regime",    text_color=txt_wht, text_size=size.small)
    table.cell(tbl, 1, 2, regime_trend ? "Trending" : regime_pause ? "Mean-Rev" : "Random", text_color=regime_trend ? color.new(bull_col, 0) : regime_pause ? color.new(bear_col, 0) : color.new(color.gray, 0), text_size=size.small)
    table.cell(tbl, 0, 3, "Direction", text_color=txt_wht, text_size=size.small)
    table.cell(tbl, 1, 3, _dir == 1 ? "▲ Bull" : "▼ Bear", text_color=_dir == 1 ? color.new(bull_col, 0) : color.new(bear_col, 0), text_size=size.small)
    table.cell(tbl, 0, 4, "AI Mult",   text_color=txt_wht, text_size=size.small)
    table.cell(tbl, 1, 4, str.tostring(ai_mult, "#.##"), text_color=txt_wht, text_size=size.small)
    table.cell(tbl, 0, 5, "Vol Rank",  text_color=txt_wht, text_size=size.small)
    table.cell(tbl, 1, 5, str.tostring(vol_rank, "#") + "%", text_color=txt_wht, text_size=size.small)
    table.cell(tbl, 0, 6, "KNN Mem",   text_color=txt_wht, text_size=size.small)
    table.cell(tbl, 1, 6, str.tostring(_n) + " bars", text_color=warmed ? color.new(color.lime, 0) : color.new(color.yellow, 0), text_size=size.small)
    table.cell(tbl, 0, 7, "─────", text_color=color.new(color.gray, 60), text_size=size.tiny)
    table.cell(tbl, 1, 7, "─────", text_color=color.new(color.gray, 60), text_size=size.tiny)
    table.cell(tbl, 0, 8, "● ▲  Long", text_color=color.new(bull_col, 0), text_size=size.tiny)
    table.cell(tbl, 1, 8, "●=H>0.65",  text_color=color.new(color.gray, 20), text_size=size.tiny)

alertcondition(long_sig,  "AI ST - Long",  "AI SuperTrend [PickMyTrade]: Bull signal — Hurst trending, KNN-optimised multiplier active")
alertcondition(short_sig, "AI ST - Short", "AI SuperTrend [PickMyTrade]: Bear signal — Hurst trending, KNN-optimised multiplier active")
alertcondition(long_sig or short_sig, "AI ST - Any Signal", "AI SuperTrend [PickMyTrade]: Signal detected")
You May Also Like
- Order Block AI [PickMyTrade] — Another PickMyTradeLib-powered indicator, this one scoring smart money order blocks with a KNN confidence engine
- Institutional Order Flow Indicator for TradingView (Free) — A CVD-based Naive Bayes signal engine built on the same score-it-don’t-just-draw-it philosophy
- Walk-Forward Optimization: Why 90% of Backtests Fail — Why a model that adapts to recent regime history still needs out-of-sample validation
- Reinforcement Learning for TradingView: A Practical Guide — A deeper look at on-chart machine learning models beyond KNN
Frequently Asked Questions
Does AI SuperTrend repaint?
No. All three signal conditions, Hurst regime, direction flip, and the EMA filter, confirm on bar close, and the KNN engine only ever reads lagged [1] values for its memory bank and current comparison. Nothing plotted in the historical record changes after the fact.
What’s the actual difference between AI SuperTrend and a standard SuperTrend?
A standard SuperTrend uses one ATR multiplier for every market condition. AI SuperTrend recomputes that multiplier every bar from a Hurst regime reading, a Garman-Klass volatility percentile, and a K-Nearest Neighbors search over the 200 most recent bars that looked similar, then gates signals entirely off during mean-reverting or random-walk regimes rather than printing a flip regardless of context.
How long does the KNN engine need to warm up?
The KNN Memory input controls it, 200 bars by default. Until the memory bank fills to at least the K Neighbors count (5 by default), the info table shows WARMUP and the script falls back to the Hurst- and volatility-scaled base multiplier without KNN optimization.
Can I use AI SuperTrend on any market or timeframe?
Yes. Every input, ATR, Hurst lookback, KNN memory, is bar-count based rather than tied to a specific timeframe or instrument, so it runs on crypto, futures, forex, or equities. Faster, more liquid instruments will fill the KNN memory bank sooner simply because more confirmed bars accumulate per unit of wall-clock time.
Do I need a paid TradingView plan to use it?
No. It runs as a standard Pine Script v6 indicator, including its PickMyTradeLib import, on any TradingView plan that supports custom indicators and library imports. Webhook alerts for automation with PickMyTrade require TradingView’s Pro plan or higher, the same as any other alert-driven strategy.
AI SuperTrend [PickMyTrade] is live on TradingView. Pine Script v6.