
Updated September 28, 2026
Table of Contents
- GPT-6 Sol vs Claude Opus 5.5: the comparison that matters
- Watch a practical comparison of the exact models
- How good are they for trading research?
- Which is better for Pine Script and Python?
- Context, reasoning and tools: what affects the experience?
- Speed and cost beyond the price per token
- A practical trading exercise for both models
- What happened when we ran the exercise
- Did each script follow the rules?
- Where the answers differed
- What this result does and doesn’t show
- The two scripts as written
- How to judge the backtest
- How to automate the reviewed strategy with PickMyTrade
- 1. Prepare a demo account and a reviewed script
- 2. Decide where exits are managed
- 3. Generate and configure the alert
- 4. Reconcile the demo workflow
- Which model should you choose?
- Frequently asked questions
- The short version
Choosing an AI for trading involves more than asking which model has the cheapest subscription. You need to know whether it understands your rules, writes correct code, finds mistakes and helps you move from an idea to a system you can test.
Claude Opus 5.5 has the stronger result on the selected independent quality benchmarks below. GPT-6 Sol offers lower measured benchmark task costs. Neither result establishes which model produces more profitable trading strategies. This article compares the available evidence, explains how to evaluate each model for your own work, and shows where PickMyTrade fits when you are ready to test automation.
We reviewed one response from each model to the same Pine Script specification. Both appear to implement the core rules on code inspection. Neither script has been compiled or backtested for this comparison, and no live alerts or broker orders have been tested. The findings concern the supplied code and explanations, not trading returns.
If you are tracking how successive model generations compare for trading work, see our earlier look at DeepSeek-V4 vs Claude 4.6 for trading.
Key Takeaways
- Claude Opus 5.5 scores higher on every benchmark reproduced below (Intelligence Index 58 vs 48; Terminal-Bench 4.0 60% vs 44%). GPT-6 Sol costs less per benchmark task ($1.06 vs $5.98).
- These are general capability benchmarks, not a trading test. In one Pine coding exercise we ran, both models’ first attempts met every stated rule on code inspection, with no clear winner. No Pine compilation, backtest, broker order or live alert was performed.
- Review any AI-written Pine Script against an explicit checklist (entries, exits, sizing, timing) before trusting it. A high benchmark score does not mean the code implements your strategy correctly.
- To automate a reviewed strategy, route TradingView alerts through PickMyTrade to a Tradovate demo account, and verify every entry and exit before considering it for live trading.
GPT-6 Sol vs Claude Opus 5.5: the comparison that matters
Artificial Analysis reports the following results for GPT-6 Sol at max effort and Claude Opus 5.5 with Adaptive Reasoning, Max Effort, Default Fallback. Higher is better in the first four rows; lower is better for cost.
| Measure | GPT-6 Sol | Claude Opus 5.5 |
|---|---|---|
| Intelligence Index | 48 | 58 |
| Terminal-Bench 4.0 | 44% | 60% |
| AutomationBench-AA | 62% | 70% |
| SciCode | 58% | 67% |
| Cost per Intelligence Index task | $1.06 | $5.98 |
These are a dated snapshot of published evaluations, not our own measurements. The source table also includes GPT-6 Luna; only the requested models are reproduced here. Artificial Analysis model comparison
The release comparison groups multiple effort settings under each model. Keep the setting attached to every number: a low-effort cost should not be presented as the price of achieving a max-effort score.
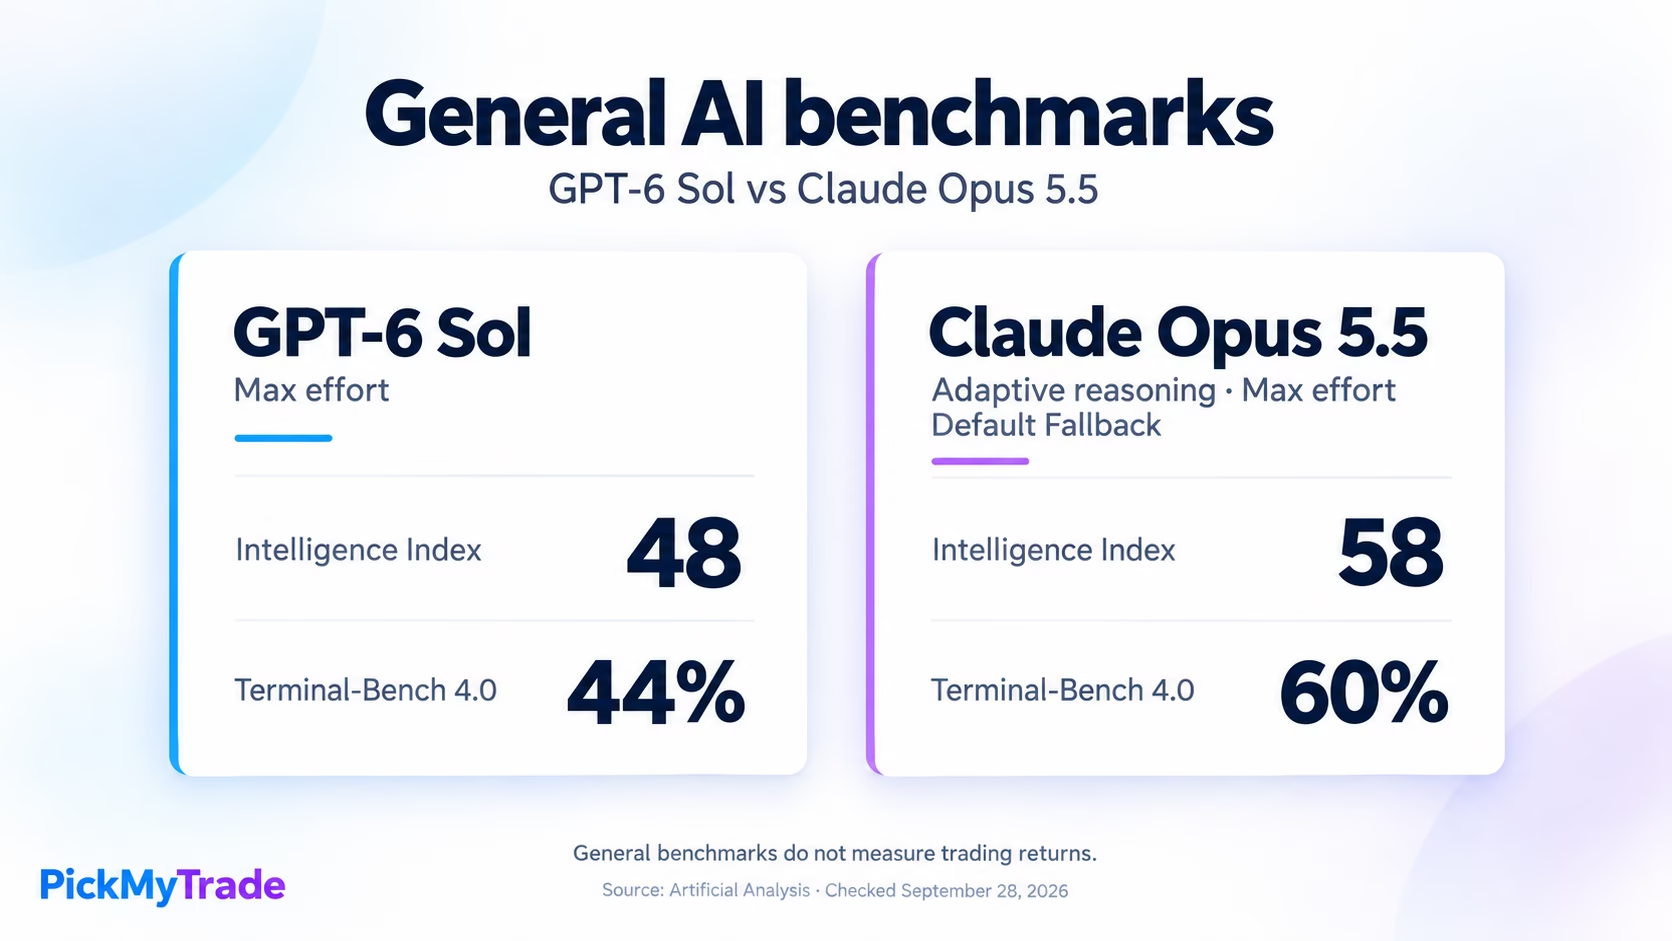
Our interpretation is that Opus deserves consideration for demanding analysis and code review, while Sol deserves consideration for repeated, clearly specified development tasks. Those are starting points for evaluation, not established winners in Pine Script or live trading.
A model could score well on coding tasks and still implement your stop incorrectly. It could also produce a profitable-looking backtest by accidentally using information unavailable at the time of a trade. The quality of the finished trading system needs a separate assessment.
Watch a practical comparison of the exact models
Nate Herk’s “I Tested Opus 5.5 vs. GPT-6 Sol on 10 Real Use Cases” is a useful companion to the benchmark table.
Video: Nate Herk | AI Automation. Watch the original on YouTube.
The creator describes comparisons involving websites, video editing, code repair and browser work, with time and cost considered alongside outputs. He also discloses discarding two tests because the models worked on shared files. Creator’s description
This is a general capabilities comparison. It does not establish a trading winner. For traders, its value is the evaluation approach: inspect the deliverable, the mistakes and the effort required to finish the task.
An older DaviddTech trading comparison is also relevant background, but the creator identifies its models as Claude Opus 4.7 and ChatGPT 5.5. Those results cannot be transferred to Opus 5.5 and GPT-6 Sol. Creator’s announcement
How good are they for trading research?
The useful question is whether the model improves a specific research task. Give it a strategy description and ask it to separate explicit rules from assumptions. Does “enter after a breakout” mean an intrabar touch, a candle close or a later retest? What happens when the setup occurs outside the intended session?
For market research, provide dated sources and ask the model to distinguish facts, calculations and opinions. An earnings summary should identify which report it used. A volatility comparison should disclose the data window and formula. A trading explanation should make uncertainty visible.
Here is a practical evaluation task:
Read this strategy description and produce three lists: rules explicitly stated, decisions still missing, and assumptions you would otherwise have to make. Do not write code until every entry, exit, sizing and timing decision is defined.
Evaluate the response against your source material. A longer answer is not automatically more useful. Reward the model that catches a missing instruction without quietly inventing a rule.
The benchmark evidence makes Opus a reasonable first candidate for complex review. Sol remains worth testing on focused tasks with clear acceptance criteria. We have not verified a model-specific advantage in predicting prices or discovering a repeatable trading edge.
Which is better for Pine Script and Python?
For Pine Script, the first gate is whether the code compiles. The more important gate is whether it implements your intended strategy.
Use this review sheet for either model:
| Question | Evidence to check |
|---|---|
| Are the entry rules correct? | Compare marked signals against several hand-checked chart examples. |
| Are exits complete? | Trace a stop, target, opposite signal and session close where applicable. |
| Is position sizing correct? | Check actual order quantity and how price movement becomes money. |
| Are timing rules explicit? | Confirm signal time, order-submission time and assumed fill time. |
| Does the model preserve the specification? | Compare each revision with the original rules. |
| Can someone maintain the code? | Look for readable inputs, comments and a clear explanation of state. |
For Python, add data checks. Ask the model to flag missing timestamps, duplicated rows, inconsistent time zones and whether a calculation uses only information available before the decision. Check that the code runs in the intended environment and that its dependencies are documented.
A good debugging response should explain the cause of an error and make a targeted correction. “Fixed” is not enough evidence. Save the original output, compiler message and revised code so you can see what changed.
Context, reasoning and tools: what affects the experience?
OpenAI lists GPT-6 Sol with a 1,050,000-token context window, 128,000 maximum output tokens, and effort settings from none through max. It supports text and image input, function calling and structured outputs. Official OpenAI model documentation
Anthropic lists Opus 5.5 with a 1-million-token context window, 128,000 maximum output tokens, and text and image input. Adaptive thinking is always on, with medium as the default effort. Its documentation also identifies tool-use and migration changes that developers should review before switching an existing integration. Official Claude model documentation
A context window is the amount of material a model can consider in a request. It is useful for reviewing code, logs and research together, but it does not guarantee that every detail will be interpreted correctly.
Also distinguish the model from the application hosting it. A browser tool, file access, a market-data connection and a broker connection are separate capabilities. Record the application and enabled tools when comparing outputs. A model with a compiler and data files has a different working environment from a model receiving only a short chat prompt.
For a chart-image exercise, check whether the model can read the symbol, timeframe and price scale before asking for interpretation. Use numerical price data when exact levels matter. Image understanding is not a substitute for a timestamped market feed.
Speed and cost beyond the price per token
The Artificial Analysis release page reports output speeds of 91 tokens per second for Sol and 97 for Opus for the displayed maximum-effort configurations. Output speed measures text generation after output starts; it is not the full wait for a completed task. Speed comparison and definition
For your workflow, measure elapsed time from the first request to a usable result, including retries, tool calls and corrections. A fast first draft can still require a long repair session.
| Standard direct API pricing | GPT-6 Sol | Claude Opus 5.5 |
|---|---|---|
| Input per million tokens | $2 | $4 |
| Output per million tokens | $10 | $20 |
Sol’s listed long-input surcharge applies when a prompt exceeds 272,000 input tokens: input and cache rates double, and output rates increase by 50% for the full request. Caching, processing options and additional tools can change the bill. These API rates are separate from chat subscription fees. OpenAI pricing details, Anthropic pricing details
For a trader building one strategy, the time required to review and correct it may matter more than a small API saving. For repeated automated research, record actual usage and successful task completion before estimating a monthly budget.
A practical trading exercise for both models
Use a deliberately simple specification to test coding discipline before requesting complex strategy research.
Illustrative exercise: a long-only EMA crossover. An EMA is an exponential moving average, which gives greater weight to recent prices. This example is a coding test, not a recommended trading edge.
Give both models this same prompt in separate workspaces:
Write a Pine Script v6 strategy for an educational comparison.

Use standard 15-minute candles. Calculate 20-period and 50-period
EMAs using closing prices. Evaluate signals only on confirmed bars.

Enter long when the 20 EMA crosses above the 50 EMA and the strategy
is flat. Exit the full long when the 20 EMA crosses below the 50 EMA.
Never short, pyramid or reverse into a short position.

Use one unit per entry and initial capital of 100,000 account-currency
units. Model commission of 2.50 per unit per side and two ticks of
slippage as illustrative assumptions, not a broker quote.

Use next-available-tick market fills rather than signal-bar closing
fills. Disable recalculation on every tick and on order fills.
Do not use alternate timeframes or future information.

Add configurable start and end timestamps. Only submit entries when
the signal bar's closing time is inside [start, end). At the first
evaluation at or after end, close an open position and submit no new
entries. Explain that its simulated fill may occur after end.

Plot both EMAs. Explain the rules and all assumptions. Do not add
filters or claim any backtest result. Identify the lack of a protective
stop and explain why this exercise is not ready for live trading.
The expected behavior can be checked without inventing a return. When a confirmed upward crossover occurs while flat and within the test window, the script should submit one long entry. Another bar with the fast EMA still above the slow EMA should not create another entry. A downward crossover should close the long without opening a short.
This exercise deliberately omits a protective stop to keep the comparison easy to inspect. Before considering a deployable version, define a stop and loss limits explicitly, then review and test the changed specification again.
Do not compare one model’s first attempt with the other model’s fifth revision. Give both the same correction budget and record each intervention. If both implementations follow identical rules and fill assumptions on identical data, substantially different trade lists are a reason to investigate.
What happened when we ran the exercise
On September 28, 2026, we gave the prompt above, unchanged, once to each model. We did not edit, correct or re-prompt either response. Neither script has been compiled in TradingView yet, and we ran no backtest. This section compares what each model wrote, not how the strategy trades.
A disclosure first: this is an AI-assisted review. Each model reviewed both responses. Claude Opus 5.5 drafted this section, we added the GPT-6 Sol review’s findings, and we checked every row against the two full responses. Both scripts are reproduced at the end of this section so you can check them yourself.
| Test condition | GPT-6 Sol | Claude Opus 5.5 |
|---|---|---|
| Where it ran | Our GPT-6 Sol workspace | Claude Code desktop app |
| Effort setting | Not recorded | Not recorded |
| Extra context or tools | Not recorded (its answer linked TradingView pages) | A Pine Script v6 reference file loaded in the workspace |
| Attempts / corrections | 1 / 0 | 1 / 0 |
| Compiled in TradingView | Not yet | Not yet |
| Time and cost recorded | No | No |
We did not match or record effort settings and tool access, so the two working environments were not identical. That can affect the result, which is why this article recommends recording these conditions.
Did each script follow the rules?
| Requirement from the prompt | GPT-6 Sol | Claude Opus 5.5 |
|---|---|---|
| Rejects Heikin Ashi, Renko and other non-standard charts, and anything other than 15 minutes | Yes | Yes |
| 20 and 50 EMAs on closing prices | Yes | Yes |
| Acts only on confirmed bars | Yes | Yes |
| Long only, one position, no pyramiding or reversal | Yes | Yes |
| 1 unit, 100,000 starting capital | Yes | Yes |
| 2.50 commission per unit per side, 2 ticks slippage | Yes | Yes |
| Market orders fill on the next tick, not the signal bar’s close | Yes | Yes |
| Recalculation on every tick and on fills turned off | Yes | Yes |
| No other timeframes or future data | Yes | Yes |
| Entries only when the signal bar closes inside [start, end) | Yes | Yes |
| Closes at the first evaluation at or after end, no new entries | Yes | Yes |
| Explains the exit fill can land after end | Yes | Yes |
| Plots both EMAs; no filters; no backtest claims | Yes | Yes |
| Names the missing stop; says it isn’t ready for live trading | Yes | Yes |
“Yes” means the rule is visible in the code or explanation, not that runtime behavior has been verified. On reading, both first attempts met every requirement. The order logic is the same in both. They use the same entry, exit and window-end conditions, so with the same chart, date window and settings they should produce the same trade list. Compiling both and comparing the trade lists is the check that would confirm this. The default date windows differ (GPT-6 Sol: 2025; Claude Opus 5.5: 2024), so set them to the same range before comparing.
Where the answers differed
Code. GPT-6 Sol stated some defaults explicitly (currency.NONE, qty_percent = 100, immediately = false) and checked the chart settings once, on the first bar. Claude Opus 5.5 added three things the prompt didn’t ask for. It added a second guard against short entries and cancelled any unfilled orders at the window end. The third, a standard-OHLC fill setting, has no effect because the script already rejects non-standard charts. None of the additions changes when the script enters or exits.
Explanation. Each response covered points the other left out.
| Point explained | GPT-6 Sol | Claude Opus 5.5 |
|---|---|---|
| Exact crossover definition; being above at the start doesn’t trigger an entry | Yes | No |
| Round-trip commission (5.00) and slippage measured in ticks, not currency | Yes | Partly (per fill, ticks) |
| An entry submitted before end can fill after end | Yes, as a general rule | Yes, with a market-closure example |
| An order can stay unfilled if no later data arrives | Yes | No |
| Settings changed in Strategy Properties override the script | Yes | No |
| Links to TradingView documentation | 3 links | None |
| One futures contract can be worth more than 100,000, so 100% margin can block fills | General warning | Specific example |
| EMA values near the start of chart history can change between loads | No | Yes |
| An entry just before end, followed by a market closure, adds another round of costs | No | Yes |
| Live-readiness gaps listed (stop, edge evidence, fill model, fees, operations, timezone) | Stop, sizing, costs, safeguards | All six |
Errors. We found two inaccuracies, both in the Claude Opus 5.5 explanation. Both reviews caught the first error. Only GPT-6 Sol’s review caught the second.
- Session-gap timing. The response says that if the end date falls in a weekend or session break, the exit fills “at the next session open.” In fact the script checks the end date when the first bar after the break closes, submits the exit then, and fills it on the next available tick, normally the second bar’s open. (TradingView strategy documentation)
- “Unlimited losses.” The response says a long “can take unlimited losses.” That is too broad. A fully paid stock position can lose at most the amount invested, while leveraged derivatives can lose more than the account. “There is no stop-defined loss limit, and losses can be substantial” is accurate. (SEC investor guide)
We found no factual errors in the GPT-6 Sol response.
Shared limitation. Both chart checks use chart.is_standard, which rejects Heikin Ashi, Renko and similar synthetic charts. It doesn’t require the Candles style specifically, so a standard Bars or Line chart also passes. That doesn’t change the calculations, but you still need to select Candles yourself.
What this result does and doesn’t show
This was one prompt, run once on each model. Both handled a tightly specified Pine task correctly on the first attempt, and neither clearly beat the other. The GPT-6 Sol answer explained cost arithmetic and order timing more precisely, linked its sources and contained no errors we found. The Claude Opus 5.5 answer said more about practical risks, but two statements in it needed correction.
The test doesn’t show which model writes better Pine Script in general. A more loosely worded or more complex specification could separate them. It also says nothing about trading performance: the strategy has no stop, hasn’t been compiled and hasn’t been backtested. The next step is to compile both scripts, run them on the same symbol and date window, and compare the trade lists. We’ll add those results here if we run that test.
The two scripts as written
Both scripts are reproduced exactly as the models returned them; the written explanations are summarized above. Neither has been compiled. Don’t use either for live trading.
GPT-6 Sol
//@version=6
strategy(
     "Educational EMA 20/50 — Long Only",
     overlay = true,
     initial_capital = 100000,
     currency = currency.NONE,
     default_qty_type = strategy.fixed,
     default_qty_value = 1,
     pyramiding = 0,
     commission_type = strategy.commission.cash_per_contract,
     commission_value = 2.50,
     slippage = 2,
     margin_long = 100,
     margin_short = 100,
     process_orders_on_close = false,
     calc_on_every_tick = false,
     calc_on_order_fills = false,
     use_bar_magnifier = false
)

// Illustrative defaults; configure these in Settings > Inputs.
// Explicit UTC offsets make the default timestamps unambiguous.
int startTime = input.time(
     timestamp("01 Jan 2025 00:00 +0000"), "Start (inclusive)"
)
int endTime = input.time(
     timestamp("01 Jan 2026 00:00 +0000"), "End (exclusive)"
)

// Validate the chart and date configuration.
if barstate.isfirst
    if not chart.is_standard
        runtime.error("Use standard candles, not synthetic chart data.")
    if not (timeframe.isminutes and timeframe.multiplier == 15)
        runtime.error("Use a 15-minute chart.")
    if startTime >= endTime
        runtime.error("Start must be earlier than end.")

// Calculate on all available chart bars, including before start.
float ema20 = ta.ema(close, 20)
float ema50 = ta.ema(close, 50)

// Calculate crosses unconditionally; act only on confirmed bars.
bool crossUp = ta.crossover(ema20, ema50)
bool crossDown = ta.crossunder(ema20, ema50)

bool entryWindow = time_close >= startTime and time_close < endTime
bool reachedEnd = time_close >= endTime

if barstate.isconfirmed
    // End-date handling has priority over crossover signals.
    if reachedEnd
        if strategy.position_size > 0
            strategy.close(
                 "Long",
                 qty_percent = 100,
                 comment = "End timestamp",
                 immediately = false
            )
    else
        if crossDown and strategy.position_size > 0
            strategy.close(
                 "Long",
                 qty_percent = 100,
                 comment = "EMA cross below",
                 immediately = false
            )
        else if entryWindow and crossUp and strategy.position_size == 0
            strategy.entry("Long", strategy.long, qty = 1)

plot(ema20, title = "EMA 20", color = color.teal, linewidth = 2)
plot(ema50, title = "EMA 50", color = color.orange, linewidth = 2)
Claude Opus 5.5
//@version=6
// Educational comparison only. Not trading advice. No performance is claimed.
strategy("EMA 20/50 Cross - Educational (Long Only)", shorttitle = "EMA 20/50 Edu", overlay = true,
     initial_capital              = 100000,
     default_qty_type             = strategy.fixed,
     default_qty_value            = 1,
     pyramiding                   = 0,
     commission_type              = strategy.commission.cash_per_contract,
     commission_value             = 2.5,
     slippage                     = 2,
     process_orders_on_close      = false,
     calc_on_every_tick           = false,
     calc_on_order_fills          = false,
     fill_orders_on_standard_ohlc = true,
     use_bar_magnifier            = false,
     margin_long                  = 100,
     margin_short                 = 100)

// ─── Constants ───────────────────────────────────────────────────────────────
const int    FAST_LENGTH = 20
const int    SLOW_LENGTH = 50
const string ENTRY_ID    = "Long"

// ─── Inputs ──────────────────────────────────────────────────────────────────
startInput = input.time(timestamp("01 Jan 2024 00:00 +0000"), "Start (inclusive)", group = "Signal window")
endInput   = input.time(timestamp("01 Jan 2025 00:00 +0000"), "End (exclusive)",   group = "Signal window")

// ─── Guards ──────────────────────────────────────────────────────────────────
if timeframe.period != "15"
    runtime.error("Apply this strategy to a 15-minute chart.")
if not chart.is_standard
    runtime.error("Use standard candles (not Heikin Ashi, Renko, etc.).")
if startInput >= endInput
    runtime.error("Start must be earlier than End.")

// Long only: an order that would open a short is blocked.
strategy.risk.allow_entry_in(strategy.direction.long)

// ─── Calculations (chart timeframe only, no request.security) ─────────────────
fastEma   = ta.ema(close, FAST_LENGTH)
slowEma   = ta.ema(close, SLOW_LENGTH)
bullCross = ta.crossover(fastEma, slowEma)
bearCross = ta.crossunder(fastEma, slowEma)

barClosed    = barstate.isconfirmed
inWindow     = time_close >= startInput and time_close < endInput
atOrAfterEnd = time_close >= endInput

// ─── Orders ──────────────────────────────────────────────────────────────────
if barClosed
    if atOrAfterEnd
        // Window over: cancel anything unfilled, close any open long, never enter again.
        strategy.cancel_all()
        if strategy.position_size > 0
            strategy.close(ENTRY_ID, comment = "Window end")
    else
        if bearCross and strategy.position_size > 0
            strategy.close(ENTRY_ID, comment = "EMA 20 < EMA 50")
        if bullCross and inWindow and strategy.position_size == 0
            strategy.entry(ENTRY_ID, strategy.long, qty = 1, comment = "EMA 20 > EMA 50")

// ─── Visuals ─────────────────────────────────────────────────────────────────
plot(fastEma, "EMA 20", color = color.teal,   linewidth = 2)
plot(slowEma, "EMA 50", color = color.orange, linewidth = 2)
How to judge the backtest
TradingView’s strategy results come from a broker emulator. Record the chart type, symbol, timeframe, date range, starting capital, size, commission, slippage and fill settings. Check for lookahead bias, meaning future information leaking into a past decision, and overfitting, meaning rules tailored too closely to the development data. Reserve an untouched period for evaluation after rules are frozen. TradingView documents these issues in its strategy testing guide.
Our suggested reporting sheet includes:
| Item | Why we would record it |
|---|---|
| First-pass compilation and repair count | Measures development effort. |
| Rule mismatches | Separates coding errors from strategy performance. |
| Entry count and completed positions | Reveals whether the sample is meaningful. |
| Net result after modeled costs | Shows the effect of the stated cost assumptions. |
| Profit factor and maximum drawdown | Adds information beyond total profit. |
| Untouched-period results | Checks behavior outside the development period. |
| Forward-test discrepancies | Reveals differences between historical simulation and current operation. |
A useful comparison publishes the full set of predefined tests. Do not choose the winning symbol after testing and present it as representative. Also avoid treating multiple partial exits as independent strategy entries.
How to automate the reviewed strategy with PickMyTrade
In the workflow below, the AI helps develop and review the rules. TradingView runs the resulting script. PickMyTrade routes its alerts to the connected broker account.
AI-assisted development → reviewed Pine Script → TradingView alert → PickMyTrade → Tradovate demo
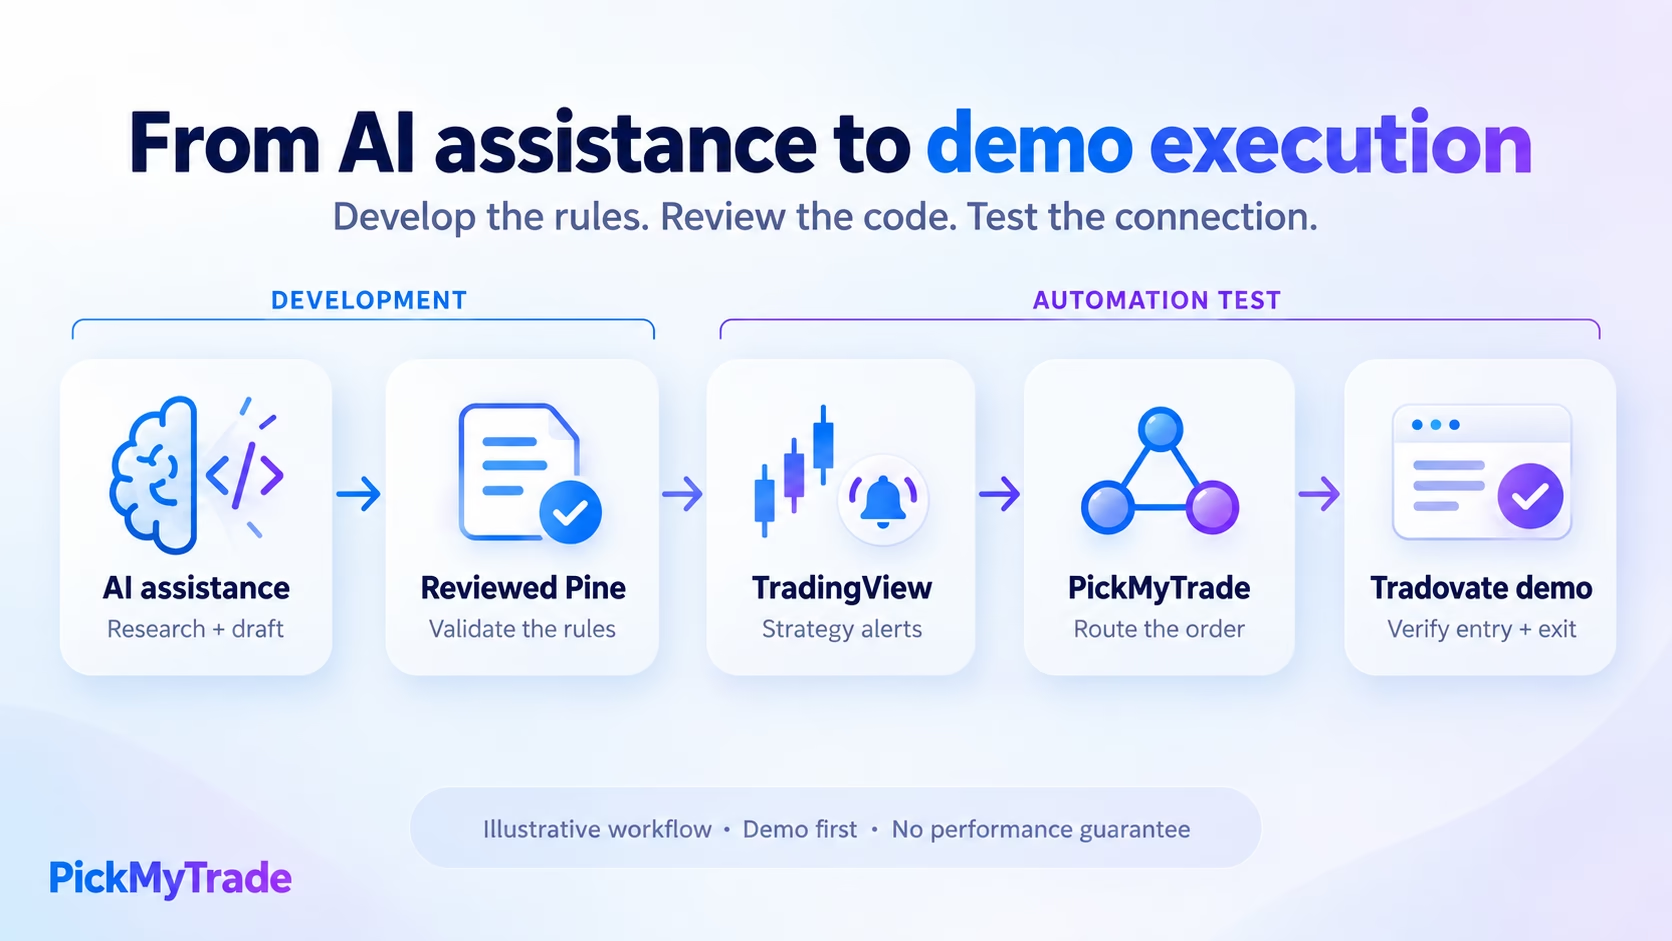
The TradingView-to-Tradovate route is documented by PickMyTrade. This article does not establish a native GPT-6 Sol or Claude Opus 5.5 connector. The AI is not asked to approve every trade in this architecture. PickMyTrade strategy automation guide
PickMyTrade’s own Jev AI is a narrower, purpose-built assistant for reviewing a trade idea inside the platform; see How to Use Jev AI for how it differs from a general-purpose chat model.
1. Prepare a demo account and a reviewed script
Use a Tradovate demo/simulation account connected to PickMyTrade and a TradingView plan supporting webhook alerts. Check the selected account, contract mapping and order quantity before enabling the workflow. Complete the strategy’s exit and risk specification first.
2. Decide where exits are managed
PickMyTrade documents different arrangements for strategy-managed exits and attached stop-loss/take-profit orders. A stop simulated inside Pine Script does not, by itself, demonstrate that a protective order exists at the broker. Choose the supported configuration for your strategy and verify the resulting broker orders. Exit-handling documentation
3. Generate and configure the alert
In PickMyTrade, generate the alert for the intended demo account. Copy the generated JSON message and current webhook URL into their respective TradingView alert fields. For the documented strategy order-fill workflow, select Order fills only. Avoid also sending custom trade messages for the same event unless you intentionally designed that behavior. Alert setup guide
Here, an order-fill alert refers to TradingView’s simulated strategy event. Confirm actual broker execution separately. TradingView also saves the script and inputs when creating an alert; later chart edits do not update that running copy. Recreate the alert after changes that should affect its behavior. TradingView alert documentation
4. Reconcile the demo workflow
Our suggested test log has one row per expected action: signal time, TradingView alert, PickMyTrade log entry, broker order ID, fill, quantity and resulting position.
Check that an entry opens the intended exposure and an exit returns the account to the expected state. Investigate missing alerts, rejected orders, repeated entries and any disagreement between the script and account before continuing. Check attached protective orders when your chosen configuration requires them.
A working entry is only one part of the test. Observe exits and the relevant session or date-boundary behavior as well. Demo testing can validate the connection and reveal operational problems; it does not guarantee live performance.
Which model should you choose?
Our evidence-based starting recommendation is to evaluate Opus first for difficult analysis or code review, and evaluate Sol first for frequent, narrowly specified coding tasks where cost matters. This recommendation reflects the published general benchmarks, not an independently measured trading advantage.
Choose using a small collection of your actual tasks: explain a strategy, implement it, fix a compiler error, inspect a trade log and identify a planted logic mistake. Record correct completions, review time and total cost.
Using one model to draft and another to review is also a proposed workflow worth testing. Agreement between them does not prove correctness. Keep the written specification and executable checks as the deciding evidence.
Frequently asked questions
The evidence reviewed here does not establish reliable price prediction or a profitable trading edge for either model. Their usefulness for research and code development should be evaluated separately from any prediction claim.
Do not assume so. Confirm the data connection available in your chosen application, its timestamps and any delay. Model specifications alone do not establish a live market-data feed.
No. A general benchmark score is not a percentage of winning trades. Strategy performance depends on the rules, data, sizing, costs and execution being tested.
The workflow described here uses AI-assisted Pine development, followed by reviewed TradingView alerts and PickMyTrade execution. A conversational AI response does not become a broker order merely because it says “buy.”
Python is not part of the Pine Script and webhook route described here. It becomes relevant if you choose to build a separate research system, data pipeline or custom application.
This architecture does not require an AI conversation for each signal. TradingView documents server-side alerts that run without the user remaining logged in. The broker connection, subscriptions and alert configuration still need to remain valid. TradingView alerts
Write down one strategy precisely and evaluate the model’s implementation against it. Once the reviewed version is ready for operational testing, follow the PickMyTrade setup guide using a Tradovate demo account and verify the complete entry-and-exit workflow.
The short version
Claude Opus 5.5 leads on the benchmarks reproduced in this article, and GPT-6 Sol costs less per task. In our single Pine coding exercise, both models’ first attempts followed every rule we set, so that test did not separate them. Evaluate Opus first for demanding analysis or code review, and Sol first for frequent, narrowly specified coding work where cost matters, then judge the result against your own written rules and review checklist rather than a leaderboard score. Once a reviewed strategy is ready, test the complete entry-and-exit workflow on a Tradovate demo account through PickMyTrade before risking real capital. Hypothetical and simulated results do not guarantee future performance.
Disclaimer:
This content is for informational purposes only and does not constitute financial, investment, or trading advice. Trading and investing in financial markets involve risk, and it is possible to lose some or all of your capital. Always perform your own research and consult with a licensed financial advisor before making any trading decisions. The mention of any proprietary trading firms, brokers, does not constitute an endorsement or partnership. Ensure you understand all terms, conditions, and compliance requirements of the firms and platforms you use.
Also Checkout: Claude AI for Trading: The Complete Resource Hub (2026)