The Nitro CRT strategy comes from a 14-minute lesson by Nitro Trades on Candle Range Theory (CRT). The idea fits in one sentence: mark one candle’s high and low, wait for the next candle to poke through one side and close back inside, then trade toward the other side.
Table of Contents
- What is the Nitro Trades CRT strategy?
- What does the Nitro CRT strategy leave to judgment?
- How does our Pine Script turn CRT into rules?
- What is Fresh session mode?
- How did we run the two-month backtest?
- Which contracts did we test?
- How did the Nitro CRT strategy perform in six markets?
- Did the Nitro CRT strategy hold up month by month?
- What did YM’s TradingView report show?
- Is the YM result proof that the Nitro CRT strategy works?
- Why did YM pass our screen?
- What did our earlier CRT tests show?
- How do you run the CRT Pine Script yourself?
- Can you automate the Nitro CRT strategy with PickMyTrade?
- Frequently asked questions
- The short version
We coded the Nitro CRT strategy as an independent Pine Script and tested it on six CME futures markets (NQ, ES, YM, RTY, GC and CL) from July 25 to September 25, 2026, with commission and slippage included. Five markets lost money. YM made $1,075 with a 1.591 profit factor across 23 trades. That’s a lead worth testing further, not a proven system, and this guide shows every result, including the ugly ones.
Nitro Trades isn’t affiliated with PickMyTrade and hasn’t reviewed or endorsed this script. This guide summarizes a public lesson and documents our own independent implementation and backtest. Every figure below comes from TradingView’s historical simulator, not from a live or demo account.
Key Takeaways
- The Nitro CRT strategy marks one candle’s high and low, waits for the next candle to sweep one side and close back inside, then aims for the other side of that range.
- In our two-month test of six futures markets, only YM made money: +$1,075, profit factor 1.591, 23 trades. The other five lost $3,310 combined.
- YM’s result is thin: without its single best trade (+$625) the profit drops to $450, and YM was simply the best of six results.
- The Pine Script is our independent adaptation, not Nitro’s code, and its alert messages aren’t PickMyTrade payloads. Test any automation on a Tradovate demo first.
What is the Nitro Trades CRT strategy?
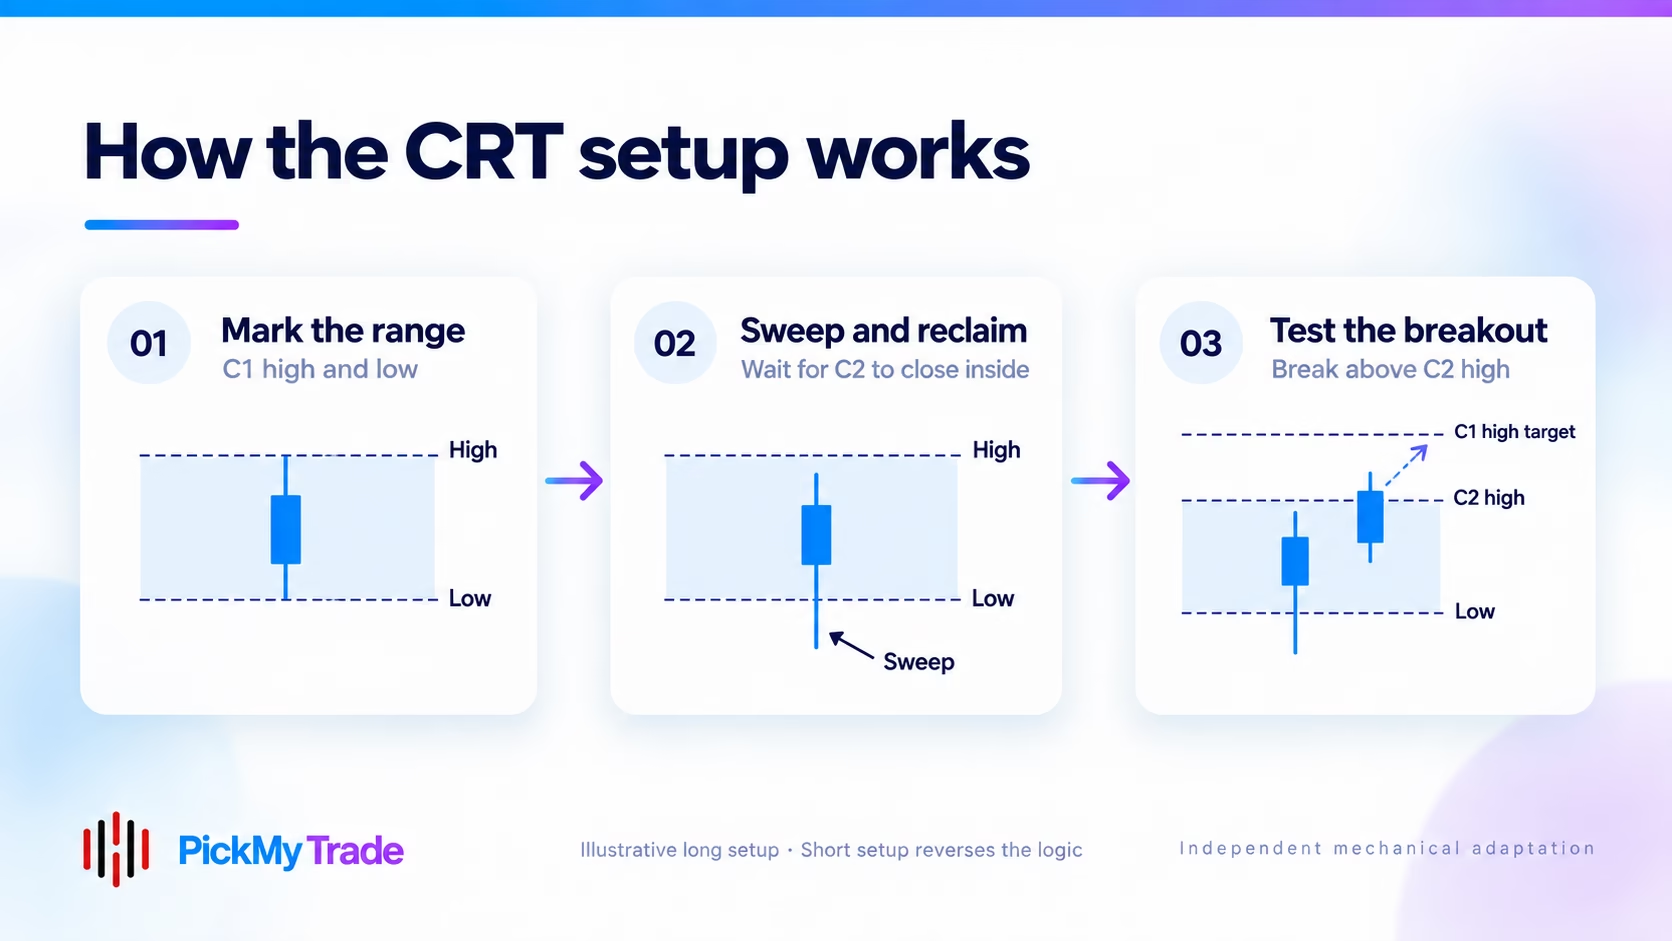
CRT stands for Candle Range Theory. You take a completed 1-hour or 15-minute candle, called C1, and mark its full high and low. Then you wait for the next candle, C2, to break one side of that range and close back inside it. The lesson expects price to travel toward the opposite side of C1.
Here’s how the lesson breaks down, with approximate video timestamps:
- Mark C1. Use the latest 1-hour candle, or the 15-minute in slower sessions, and mark its high and low, wicks included (about 1:17 to 1:56).
- Wait for the sweep and reclaim. C2 must break the high or the low and then close back inside. If its body closes beyond the level, even slightly, the lesson says it isn’t a valid setup (about 1:58 to 2:41).
- Look to the other side. After a break of the high, expect a move toward C1’s low, and the reverse after a break of the low (about 2:43 to 3:41).
- Enter on a lower timeframe. Nitro drops to a 1- or 2-minute chart and enters when price breaks C2’s high for a long or C2’s low for a short (about 2:43 to 5:12).
- Target C1’s other side. The stop is sized for roughly 1.5 to 2 reward/risk, and Nitro says he mixes both (about 3:44 to 4:01).
What does the Nitro CRT strategy leave to judgment?
Quite a lot. Nitro says CRT works in any session but prefers 9:30 a.m. to 1:00 p.m. Eastern, plus 7 to 10 p.m. Eastern for Asia (about 4:30 to 5:12). He’s fine with either a direct breakout entry or waiting for confirmation (about 8:58 to 9:23), and he raises his stop by hand as a trade moves (about 11:48 to 12:04). A script can’t do any of that without extra rules.
The video’s title and its talk of a high win rate are the creator’s own claims. We haven’t verified them, and a title isn’t evidence of an edge. What follows tests one mechanical version of the idea.
How does our Pine Script turn CRT into rules?
A discretionary lesson needs hard rules before a script can trade it. Our Pine Script version of the Nitro CRT strategy keeps the C1 and C2 idea and fills every gap with an explicit choice. Some choices are ours, not Nitro’s, so the table marks where the script departs from the video.
| Piece | In the video | In our Pine Script |
|---|---|---|
| Setup candles | 1-hour, or 15-minute in slower sessions | 60-minute C1 and C2, built only from complete, consecutive candles on the chart |
| Sweep and reclaim | C2 breaks C1’s high or low, then closes back inside | C2 sweeps one side only and closes strictly inside C1. Sweeps of both sides, and closes exactly on a boundary, are rejected |
| Entry | Lower-timeframe break of C2’s high (long) or low (short), direct or after confirmation | Stop order one tick beyond C2’s high or low, placed only after C2 has closed. Direct breakout, no confirmation |
| Target | C1’s opposite side | A limit order at C1’s opposite extreme |
| Stop | About 1.5 to 2 reward/risk, adjusted by hand | Fixed at a planned 2:1 reward/risk from the expected fill to the target, rounded up to whole ticks. It isn’t necessarily beyond C2 |
| Trading hours | Any session; prefers 9:30 to 13:00 Eastern | Weekdays 09:30 to 13:00 New York. Pending orders are cancelled and open trades closed at 13:00 |
| Execution chart | 1- or 2-minute | 15-minute (our adaptation) |
| Limits | None stated | Ours: one position at a time, at most three filled entries a day, setups expire after three hours, and at least four ticks of reward must remain |
What is Fresh session mode?
In “Fresh session” mode, C2 must close inside the 09:30 to 13:00 window, so an early candidate can’t block a later one. That rule is our adaptation, and we added it after looking at some September NQ trades, which matters when you read the results below.
Download: nitro-crt-two-month-scan.zip holds the exact Pine v6 script we tested and a short README with the settings. It compiled and was saved in TradingView on September 25, 2026.
How did we run the two-month backtest?
We ran one fixed test of the Nitro CRT strategy on six CME futures markets: NQ, ES, YM, RTY, GC and CL. Each used 60-minute setup candles, 15-minute execution candles, one contract and $100,000 of simulated capital, from July 25 to September 25, 2026 (end date excluded, UTC). We changed nothing between markets.
- Same rules everywhere. Fresh-session mode, a planned 2:1 reward/risk, a 09:30 to 13:00 New York entry window and no more than three entries a day. We fixed the protocol before collecting any results.
- Costs included. $2.50 commission per contract per side and two ticks of slippage on market and stop orders. Limit orders fill only after price trades one tick through them.
- TradingView’s simulator settings. Standard candles, electronic trading hours, continuous front-month contracts with back-adjustment off, default bar detail of 4 ticks per bar, calculation on bar close, a one-tick order delay and 5% simulated margin. We didn’t use Bar Magnifier.
- 15-minute execution. On our TradingView plan, 1-minute charts reached back only about five days, so we used 15-minute execution candles to cover two months. The video uses 1 to 2 minutes, so this is a coarser test.
- Every trade checked. We captured all 148 closed trades and reconciled each market’s net P&L, win count, profit factor and commissions against TradingView’s report. Nothing disagreed beyond displayed rounding.
Which contracts did we test?
| Market (CME specs) | TradingView feed | Tick size | Value per point |
|---|---|---|---|
| NQ, Nasdaq-100 | CME_MINI_DL:NQ1! | 0.25 | $20 |
| ES, S&P 500 | CME_MINI_DL:ES1! | 0.25 | $50 |
| YM, Dow | CBOT_MINI_DL:YM1! | 1.00 | $5 |
| RTY, Russell 2000 | CME_MINI_DL:RTY1! | 0.10 | $50 |
| GC, Gold | COMEX_DL:GC1! | 0.10 | $100 |
| CL, Crude oil | NYMEX_DL:CL1! | 0.01 | $1,000 |
Point values come from each chart’s diagnostics and match CME’s contract specifications. A point is worth $5 on YM and $20 on NQ, so one contract isn’t equal risk across markets.
How did the Nitro CRT strategy perform in six markets?
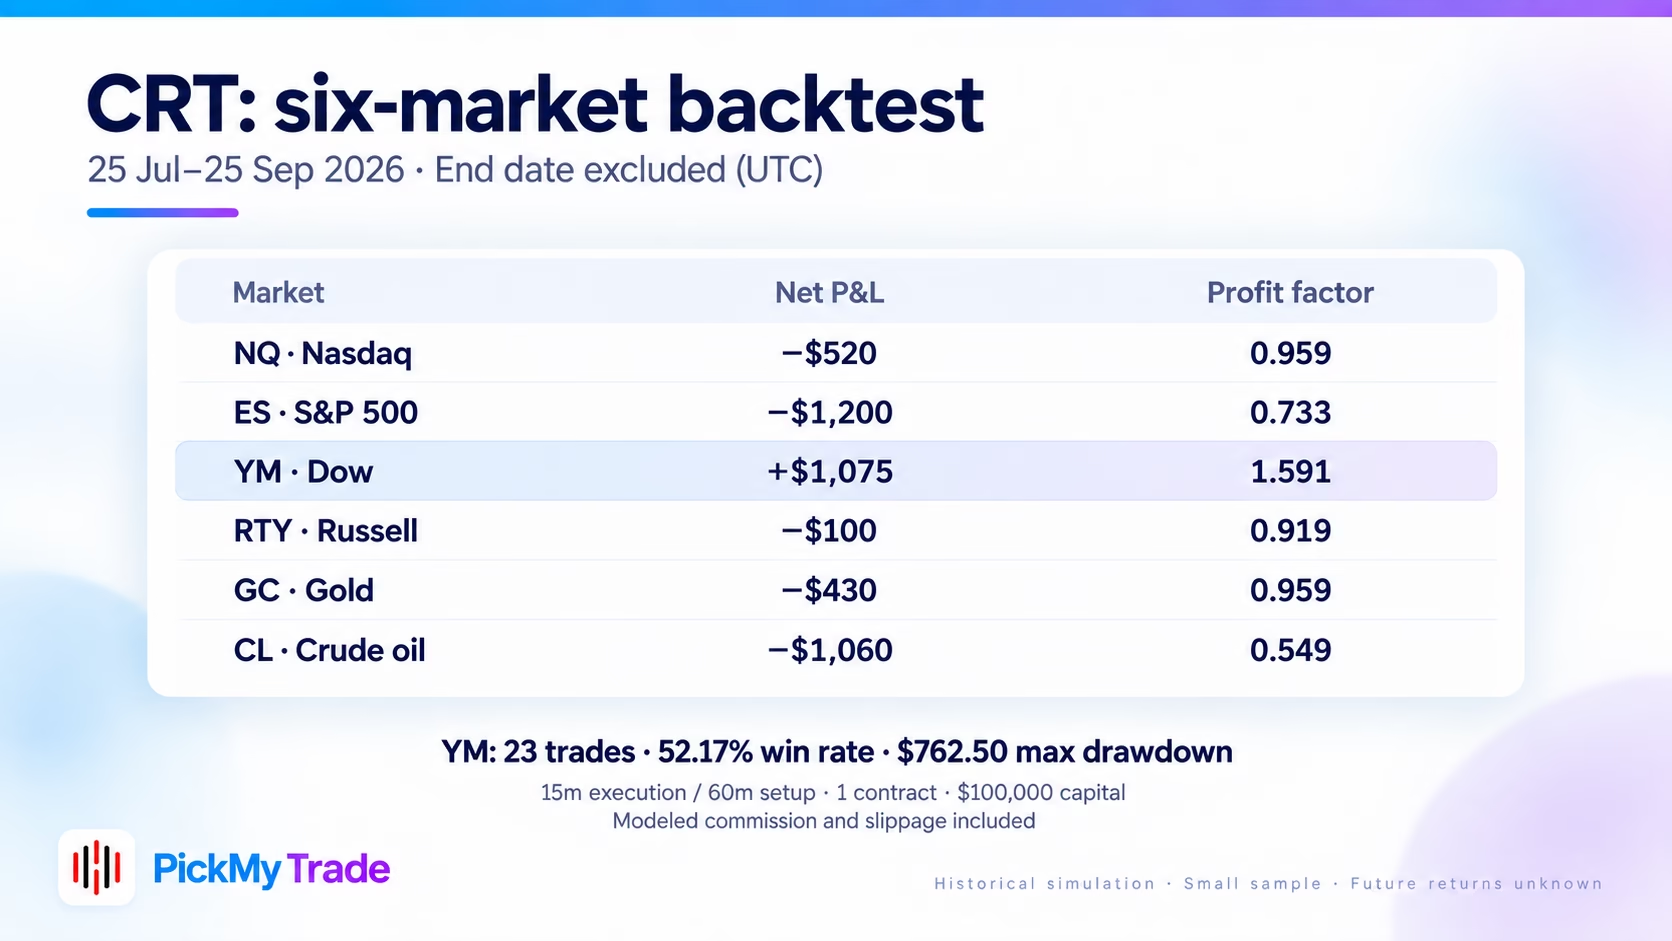
Five of six markets lost money. YM returned +$1,075 with a 1.591 profit factor, 23 trades, a 52.17% win rate and a $762.50 maximum drawdown. NQ lost $520, ES $1,200, RTY $100, GC $430 and CL $1,060. All figures include modeled commission and slippage.
Profit factor is total winning P&L divided by total losing P&L. Above 1 means winners outweighed losers in that sample. It isn’t a win probability.
| Market | Net P&L | Profit factor | Trades | Win rate | Max drawdown |
|---|---|---|---|---|---|
| NQ, Nasdaq-100 | −$520 | 0.959 | 28 | 46.43% | $5,722.50 |
| ES, S&P 500 | −$1,200 | 0.733 | 30 | 43.33% | $2,532.50 |
| YM, Dow | +$1,075 | 1.591 | 23 | 52.17% | $762.50 |
| RTY, Russell 2000 | −$100 | 0.919 | 17 | 41.18% | $847.50 |
| GC, Gold | −$430 | 0.959 | 34 | 38.24% | $3,292.50 |
| CL, Crude oil | −$1,060 | 0.549 | 16 | 37.50% | $1,497.50 |
Did the Nitro CRT strategy hold up month by month?
Only YM stayed positive in both halves of the test: +$335 from July 25 to August 25 and +$740 from August 25 to September 25. NQ and ES lost in the first month and recovered in the second, RTY and GC did the opposite, and CL lost in both.
What did YM’s TradingView report show?
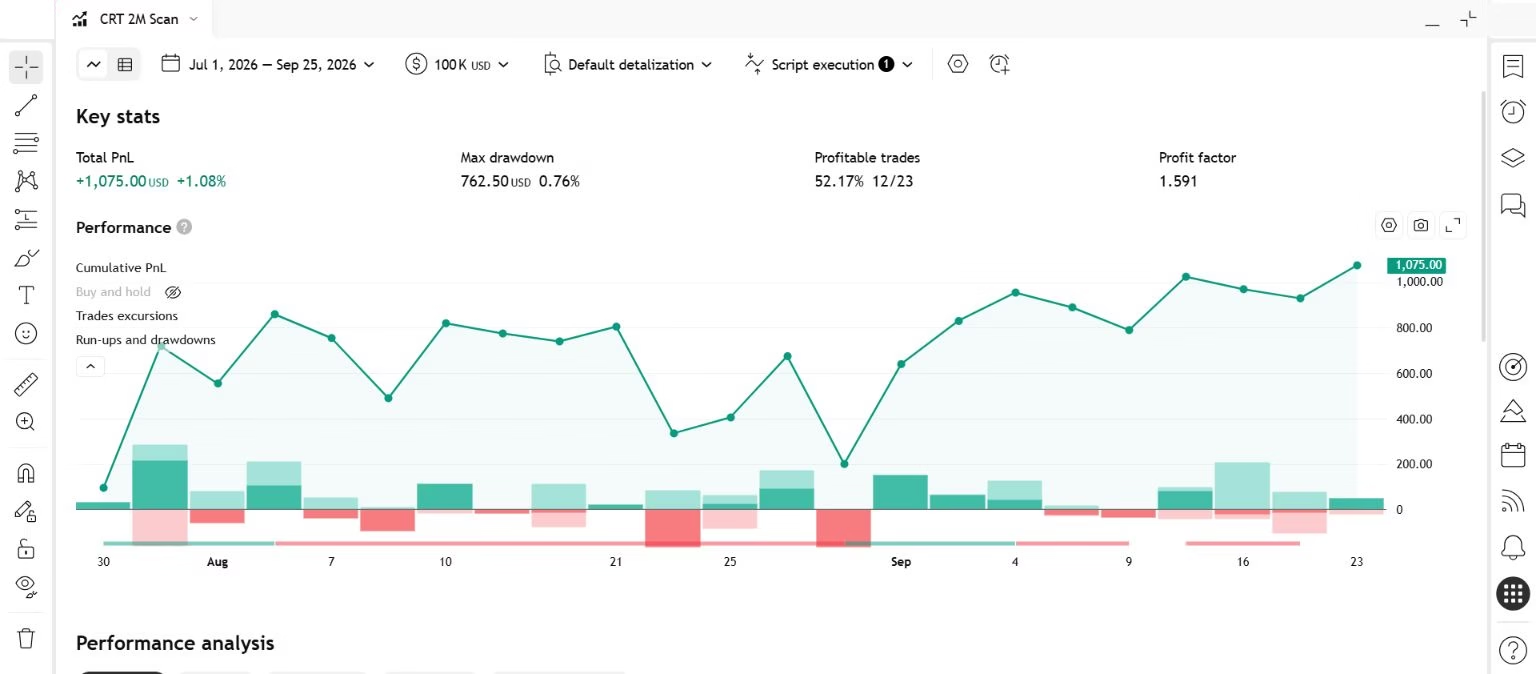
YM had 12 winners and 11 losers, $2,895 in gross profit against $1,820 in gross loss, and $115 in commission. Average net P&L per trade was $46.74, and TradingView reported no margin calls in that run. Here’s the report.
Is the YM result proof that the Nitro CRT strategy works?
No. YM is the best of six results, which is the kind of number that looks better than it is. It rests on 23 trades, and one +$625 winner supplies more than half of the profit.
- We picked the best of six. Keeping the winner from several markets is what TradingView calls selection bias, and tuning rules to past data is overfitting. We didn’t tune anything per market, but picking the top result from six still flatters it.
- One trade carries it. YM’s largest winner was +$625 on July 31. Without it, the two-month result is +$450 and the first month turns from +$335 to −$290. That’s arithmetic, not a rerun, and it shows how few trades support the result.
- The second month isn’t a clean test. We built the Fresh-session filter after looking at September NQ trades, so August 25 to September 25 isn’t unseen data.
- The simulator guesses inside each bar. With 15-minute candles, many trades enter and exit within one bar: 5 of 23 on YM, 17 of 30 on ES and 17 of 34 on GC. TradingView’s broker emulator assumes a price path inside each bar, and Bar Magnifier can refine it. We didn’t run it. YM’s 5 same-bar trades added +$205, and we can’t verify the real order of their fills.
- Contracts and rolls differ. A point is worth $5 on YM and $20 on NQ, so dollar results and drawdowns aren’t comparable across markets. Continuous contracts also stitch rolls together, so the fills don’t come from one unchanged contract.
Why did YM pass our screen?
Before running the scan we fixed a screening rule: among markets with a positive first month and at least 10 trades in each month, take the one with the best first-month profit factor, then check it in the second month without changes. YM was picked, and it stayed positive in month two. GC also qualified in month one but lost $580 in month two. Passing that screen makes YM a candidate for more testing, nothing more.
US regulators take this hindsight problem seriously. CFTC Rule 4.41 requires commodity pool operators and commodity trading advisors to warn that simulated results don’t represent actual trading and are designed with the benefit of hindsight. This article isn’t investment advice, but the warning fits every number in it.
What did our earlier CRT tests show?
Earlier NQ tests were small and mixed. Our first version lost on two of three setups over five days, and a later “Fresh session” version made +$1,455 on seven development trades, then lost $205 on the next three. That history is why the six-market scan isn’t a clean out-of-sample test.
| Test | Chart and dates | Trades | Net P&L |
|---|---|---|---|
| First version, 60-minute setup | NQ 1-minute, Sep 21 to 25 | 2 | −$1,525 |
| First version, 15-minute setup | NQ 1-minute, Sep 21 to 25 | 3 | −$775 |
| First version, 30-minute setup (extra comparison) | NQ 1-minute, Sep 21 to 25 | 3 | +$1,425 |
| Second version, control | NQ 5-minute, Aug 31 to Sep 25 | 10 | −$405 |
| Second version, Fresh session | NQ 5-minute, Aug 31 to Sep 25 | 10 | +$1,250 |
In the 30-minute run, one short made $1,335 of the $1,425. In the second version, the whole gap between control and Fresh session came from one trade on September 2: the control’s −$1,065 short was replaced by a later +$590 long. No mode passed our own acceptance gate of positive net profit, a profit factor above 1.2 and at least eight trades in the development period. Each had seven.
How do you run the CRT Pine Script yourself?
Load YM on a 15-minute chart, paste the script and keep every setting unchanged. Then compare your report with ours. Small differences are normal, and you shouldn’t tune the script until it matches.
- Open TradingView and load
CBOT_MINI_DL:YM1!, or the same continuous YM feed on your plan. Use standard candles, 15 minutes, electronic trading hours and back-adjustment off. Load history from before July 25 so the 60-minute setups have warm-up bars. - In the Pine Editor, paste
nitro-crt-two-month-scan.pinefrom the download, save a private copy and add it to the chart. It should compile without errors, and the diagnostic table should show both date boundaries as loaded. - Set Research mode to Fresh session, the range/sweep timeframe to 60 and Evaluation phase to Full bounded period. Leave the frozen dates and other inputs alone.
- Check Properties: $100,000 capital, one contract, no pyramiding, $2.50 commission per contract per side, 2 ticks of slippage, 5% margin, limit fills one tick beyond the requested price, default bar detail (4 ticks per bar), calculation on bar close and a one-tick order delay.
- Open the Strategy Tester and compare: +$1,075 net, 1.591 profit factor, 23 trades, 52.17% winners and $762.50 maximum drawdown.
The report’s date button shows history loaded from July 1. The script’s date filter is what limits trades to July 25 through September 24. A different plan, feed, roll history or emulator update can change the result. If yours differs, record what changed rather than editing rules to chase our number.
Can you automate the Nitro CRT strategy with PickMyTrade?
Not as it stands. The script’s alert messages, such as RESEARCH_CRT_LONG and RESEARCH_CRT_SHORT_EXIT, are research labels, not PickMyTrade webhook payloads. We haven’t sent a single demo or live order from this strategy.
The route we’d test is a TradingView strategy alert, then PickMyTrade, then a Tradovate demo account. PickMyTrade’s strategy automation guide covers generating the alert configuration, and its Tradovate demo guide covers simulation mode. Those guides verify the general workflow, not this script.
- Generate the account-specific alert configuration in PickMyTrade instead of pasting the script’s research labels.
- Check symbol mapping and contract quantity for your demo account. The script always trades one contract.
- Verify an entry, a stop exit, a target exit and the 13:00 New York window-end exit, and confirm each exit flattens the position instead of opening an opposite one.
- Decide who manages protection. In Pine, the stop and target are simulated exits, not resting orders at your broker.
For practice, see our guides to paper trading a TradingView strategy on Tradovate and testing a strategy on a Tradovate demo before you fund it. If the account is a prop firm evaluation, read how trailing drawdown works for automated futures traders first.
For a longer test of a related sweep model, with settings chosen on one period and tested unchanged on the next, see our TJR Asia session sweep backtest on NQ.
Frequently asked questions
No. It’s an independent mechanical adaptation of a public lesson. Nitro Trades hasn’t reviewed or endorsed it, and it doesn’t reproduce his discretionary entries, stops or trade management.
No. Five of six markets lost money over the two months. YM made $1,075 on 23 trades, one winner supplied more than half of it, and YM was the best of six results. Treat it as a lead for further testing, not evidence of an edge.
We can’t tell from this sample. Two months and 16 to 34 trades per market can’t separate a real difference between markets from luck. Contract values also differ, so one contract isn’t equal risk across markets.
On our TradingView plan, 1-minute charts reached back only about five days. Fifteen-minute candles gave us two months of history, at the cost of coarser fills. The video’s 1- to 2-minute entries aren’t tested here.
We haven’t tested it against any firm’s rules, daily loss limits or drawdown calculation, and it has no broker connection. Start on a demo account, log real fills and slippage, and read your firm’s rules before anything else.
No. The RESEARCH_CRT alert messages are labels for research, not valid webhook payloads. Generate the alert configuration in PickMyTrade and test it on a Tradovate demo account.
The short version
The Nitro CRT strategy is a clear, testable idea, and turning it into rules was the easy part. In two months across six futures markets our version lost money in five, and the one that worked did so on 23 trades and one big winner. If you want to explore it, use the script, a demo account and more data than we had, and keep the losing markets in your notes.
Disclaimer:
This content is for informational purposes only and does not constitute financial, investment, or trading advice. Trading and investing in financial markets involve risk, and it is possible to lose some or all of your capital. Always perform your own research and consult with a licensed financial advisor before making any trading decisions. The mention of any proprietary trading firms, brokers, does not constitute an endorsement or partnership. Ensure you understand all terms, conditions, and compliance requirements of the firms and platforms you use.
Also Checkout: Andrea Cimitan’s Opening Range Breakout Strategy: Rules, Settings & Backtest (NQ)