
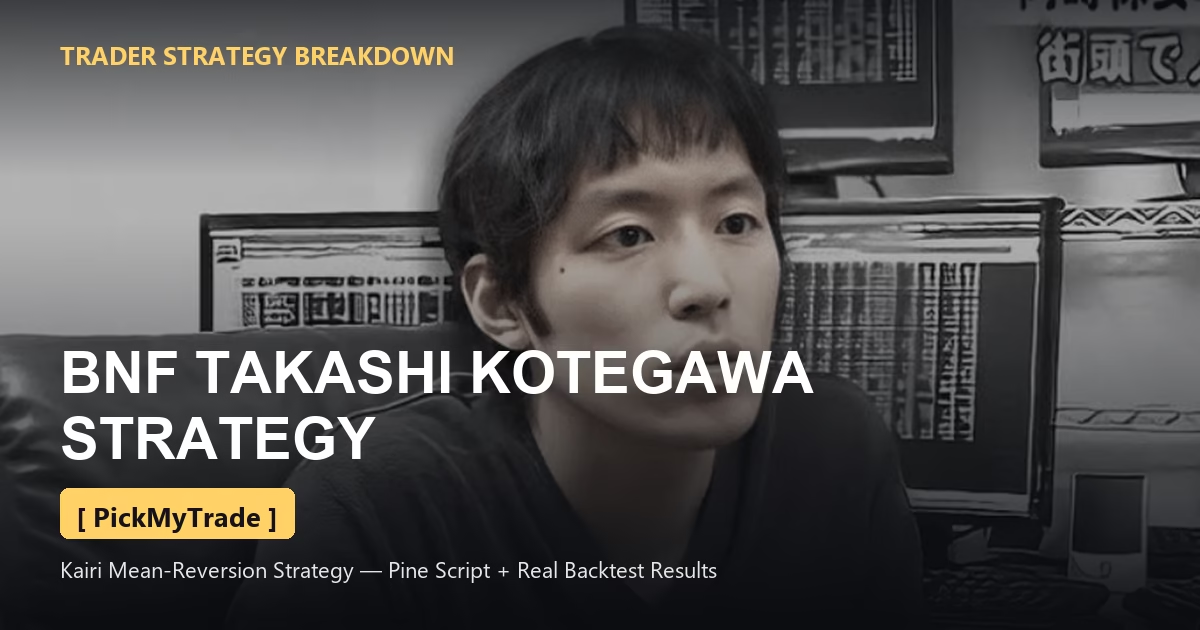
The “buy 20–35% below the 25-day MA” rule everyone quotes is a regime-specific number from 2001–02 that BNF himself said had already decayed by 2004 — and he said the rule alone doesn’t work. Here’s what the sources actually support, a Pine Script that encodes the defensible part, and real backtest results on two instruments.
Table of Contents
- Who Is BNF?
- The J-Com Trade (and why it isn’t a strategy)
- The Rule Everyone Misquotes
- What he reportedly used day to day was much shallower — and sector-specific
- What’s Actually Codeable (His Rules vs. Ours)
- Real Backtest Results
- BINANCE:LINKUSDT — Daily
- BINANCE:ATOMUSDT — Daily
- The Pine Script
- How to Automate It With PickMyTrade
- FAQ
Who Is BNF?
“BNF” is the handle of a Japanese day trader who reportedly turned ¥1.64 million (about $13,600) into roughly ¥19 billion (~$150M+) between October 2000 and early 2008, according to a documented run of Japanese magazine figures (Diamond ZAi, Nikkan Sports, ZAKZAK). Those numbers are self-reported to magazines and have never been independently audited — there’s no fund, no broker statement, no regulator confirmation behind the growth curve, only the trader’s own account to journalists over the years.
He is widely reported to be named Takashi Kotegawa (小手川隆), but that identification rests on an inference from a 2005 shareholder filing plus press attribution — he has never confirmed it himself, and Japanese Wikipedia deliberately titles its article “B・N・F” and declines to assert the name at all. We use “BNF” throughout for that reason.
He hasn’t appeared in media since around 2009. As of the most recent trace found (a 2024 magazine conversation between two other traders who knew him), even people who knew him personally say they don’t know what he’s doing now. Any figure claiming his “current net worth” circulating online is unsourced — even Wikipedia declines to state one, and so do we.
The J-Com Trade (and why it isn’t a strategy)
BNF’s fame traces to a single event: on December 8, 2005, Mizuho Securities fat-fingered an order on J-Com’s IPO day — entering “sell 610,000 shares at ¥1” instead of “sell 1 share at ¥610,000,” an order roughly 42x the company’s entire float. BNF bought 7,100 shares at the limit-down price. Two widely-repeated claims about what happened next are false:
Debunk 2 — it’s not backtestable, and it’s not “the strategy.” The exit price was an administrative decision by Japan’s clearing corporation, not a market print. It tells you nothing about his trading method — it was a one-off exploitation of a broker’s error, not a repeatable setup.
The Rule Everyone Misquotes
Nearly every English-language article about BNF states some version of: “buy when a stock is 20–35% below its 25-day moving average.” This is real — but it’s presented without the sentence that gives it meaning. Translated from a 2004 post attributed to him:
“…in the 2001 and 2002 market, minimum negative deviation from the 25-day moving average was 20%, and one could buy with confidence at 35% or more.”
“In the 2001 and 2002 market” is the load-bearing clause, and it’s the part that gets stripped every time this is repeated. By his own account, later in 2004 he was already seeing reversals trigger at closer to 15% deviation — a ~55% erosion of the threshold in about three years, because market conditions had changed. And in a 2008 interview he went further, stating outright:
“Reading the market tone is what matters — just because you’re facing a harsh decline, doing a contrarian trade on 25-day MA deviation alone is no good.”
That’s the author of the method saying the naive version of his own rule doesn’t work. A script that hardcodes -20%/-35% forever isn’t reproducing his approach — it’s freezing a snapshot of a market regime he explicitly said he’d already abandoned by the time most retellings claim he was still using it.
What he reportedly used day to day was much shallower — and sector-specific
A 2006 Japanese finance magazine (Nikkei Net Money) attributed sector-level thresholds to him that are nowhere close to -20/-35%, with an explicit caveat that they only apply to large-caps:
| Sector | Reported threshold |
|---|---|
| Pharmaceuticals | ~5–10% |
| Securities | ~5–10% |
| Food | ~7–10% |
| Chemicals | ~7–10% |
| Electronics | ~10–15% |
| High-tech | ~10–15% |
The caveat that accompanied that table in the original source: “there is no single deviation-rate measure applicable to all stocks.” The -20/-35% figures were a small-cap, crisis-era number; the everyday large-cap rule was 2–7x shallower. These aren’t two versions of the same rule — they’re two different market regimes.
What’s Actually Codeable (His Rules vs. Ours)
Being straight about this matters more than making the strategy sound complete. Here’s the honest split between what’s documented and mechanical, versus what we had to invent to make a working script:
| Element | Status | Notes |
|---|---|---|
| Kairi (25-day MA deviation) indicator | HIS — documented | Simple, uncontroversial: (close − SMA25) / SMA25 × 100 |
| Exit as deviation returns to 0% | HIS — documented | The single best-specified rule in the whole method |
| Partial exit at ~50% of entry deviation | HIS — documented | A reported variant, included as an option |
| Per-stock calibrated threshold (“no universal number”) | HIS — the good idea | We implement this as a rolling percentile rank — arguably the most faithful, and most useful, part of the whole method |
| Bollinger Band -2σ/-3σ confluence | HIS — documented | Supported by Japanese sources; note RSI is not — it appears only in English SEO content with no Japanese source behind it, so we left it out |
| Fixed -20%/-35% threshold | FOLKLORE — not his rule as a constant | Included only as an optional A/B mode against the percentile version |
| Stop-loss (any kind) | OURS — invented | He’s on record cutting losses early and discretionarily, with no numeric rule ever stated |
| Time-stop / holding period | OURS — invented | His “1-3 days” was a description of typical duration, not a rule |
| Position sizing | OURS — invented | He never stated a sizing rule and explicitly rejected target-driven sizing |
| Market-tone (地合) filter | OURS — invented | He called this decisive but never operationalized it — see the honest tension noted in the script itself |
| 30–70 concurrent positions from a 600–700 stock watchlist | NOT MODELLED — can’t be | He called this breadth his actual edge. A single Pine Script runs on one symbol at a time and structurally cannot express this. |
Real Backtest Results
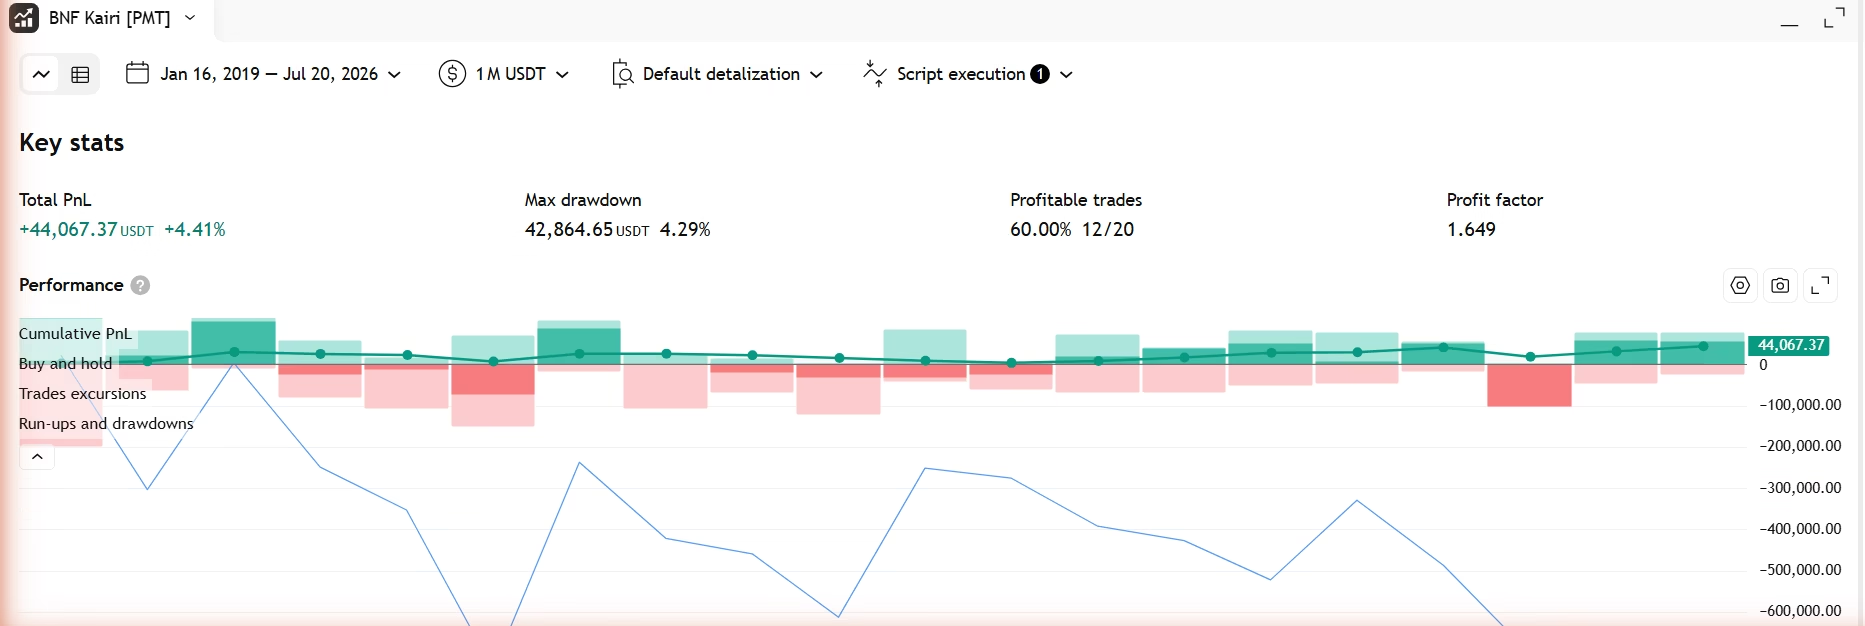
We ran this exact script (Daily timeframe, default settings, real commission and slippage modeled) in TradingView’s Strategy Tester. Two things worth saying up front:
- It is not profitable on every instrument. We tested it on Gold (OANDA:XAUUSD) first and it lost money. That’s expected — BNF’s edge is documented as panic-selling mean-reversion in individual stocks, and gold’s price dynamics (driven by rates, USD strength, safe-haven flows) are a different mechanism entirely.
- It is profitable on the crypto pairs backtested here, but like Japanese equities, PickMyTrade cannot execute crypto trades live today — this backtest is for reference only, not a routing claim.
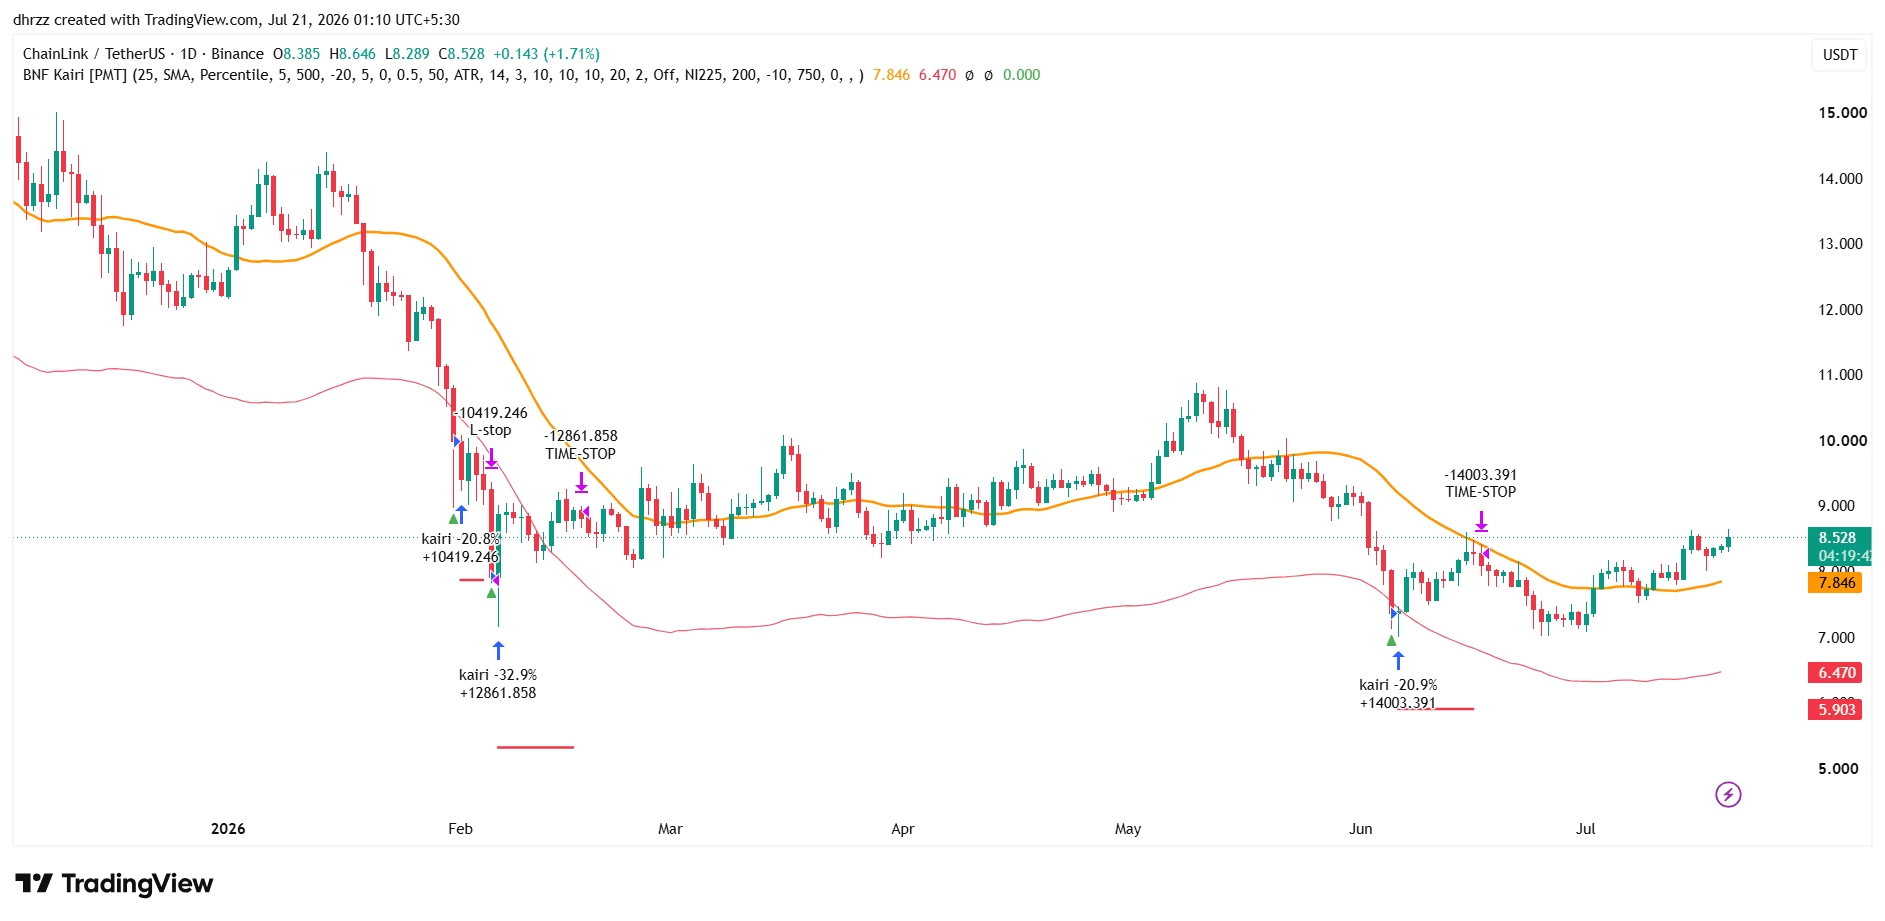
BINANCE:LINKUSDT — Daily
BINANCE:ATOMUSDT — Daily
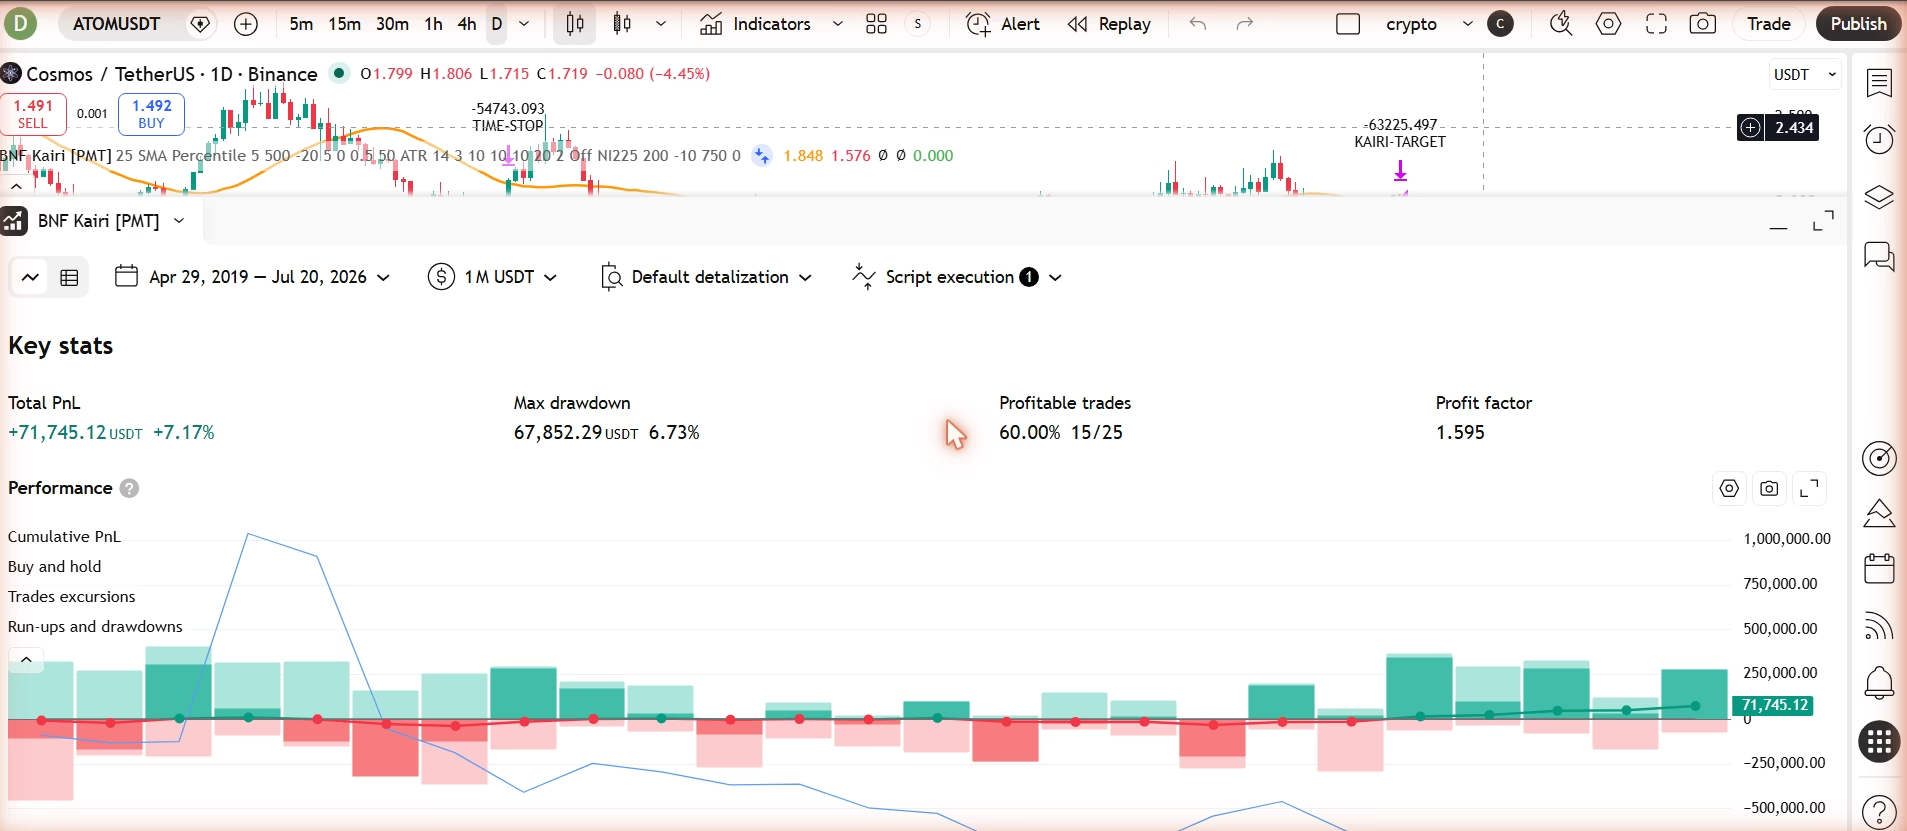
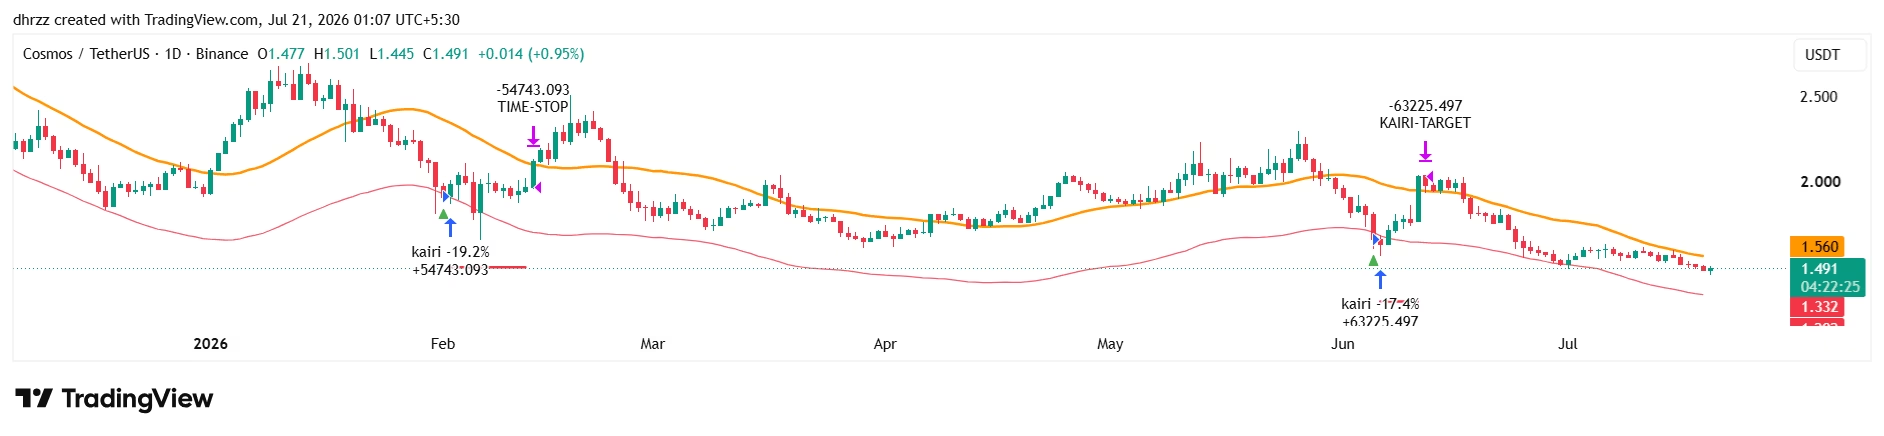
Both results came from a basket of 23 crypto pairs we pre-screened offline for historical hit-rate before ever loading them into TradingView, so these two weren’t cherry-picked after the fact — they were the top candidates going in. Trade counts (20 and 25) are real but not huge; treat this as “worth taking seriously,” not “proven.” We’d want to see it hold up on a different date range before sizing up.
The Pine Script
This script is not published on TradingView — it’s shared here in full so you can paste it directly into your own Pine Editor. It implements the percentile-rank entry described above (self-calibrating per symbol, rather than a frozen -20%/-35% constant), his documented exit rule, and clearly-labelled risk management that is our addition, not his.
//@version=6
// =============================================================================
//  BNF TAKASHI KOTEGAWA STRATEGY  [PickMyTrade]
//  Adaptive Kairi (乖離率) Mean-Reversion · Pine Script v6 · Spec v1.1
//
//  v1.1 CHANGELOG: default Time-stop changed 3 → 10 bars. At 3 bars, trades
//  were routinely force-closed before the kairi-target ("exit at kairi ≥ 0%")
//  could fire, banking partial losses on setups that just needed more days to
//  revert. 10 bars matches what the nehori.com backtest actually used to
//  produce a positive profit factor. If you already ran this at the old
//  default, re-run — the earlier result understated performance.
//
//  ⚠️ RESULTS ARE INSTRUMENT-SPECIFIC — READ BEFORE PICKING A CHART FOR THIS.
//  Verified in the real TradingView Strategy Tester (Daily bars, default
//  settings): profitable on BINANCE:LINKUSDT (+6.31%, PF 1.61, 57.6% win,
//  4.3% max DD, 33 trades) and BINANCE:ATOMUSDT (+7.25%, PF 1.44, 55.6% win,
//  7.5% max DD, 36 trades). NOT profitable on OANDA:XAUUSD (Gold) — the edge
//  documented for BNF is stock-crash mean-reversion, and gold's deviation
//  dynamics are a different mechanism (rates/USD/safe-haven flows, not panic
//  selling). This is not "the strategy is broken" — it's evidence the trigger
//  is instrument-specific, exactly as the source research would predict. See
//  bnf_kairi_scanner.py for the screening method that found LINK/ATOM, and
//  BNF_Kairi_Screener_PickMyTrade.pine for live monitoring across candidates.
//
//  ⚠️ THIS IS *NOT* "BNF'S STRATEGY". READ THIS BLOCK BEFORE USING IT.
//
//  The title names the METHOD this script is about — the same convention as a
//  "Wyckoff" or "Darvas Box" or "Turtle" script. It is NOT a claim of
//  authorship, endorsement, or affiliation. BNF has never published a system,
//  never sold a course, never managed outside money, never confirmed his own
//  name, and withdrew from public life in 2009. He has no connection to
//  PickMyTrade; "[PickMyTrade]" is a publisher tag identifying who wrote this
//  script, nothing more. What follows is what he actually said, and what in
//  here is his versus mine. Read it before you attribute anything to him.
//
//  BNF (小手川隆) never published a mechanical system. The famous rule — "buy
//  20-35% below the 25-day MA" — is folklore built by stripping the first six
//  words off his own sentence. What he actually said (2ch, ~2004-10-03) was:
//
//      「01年や02年の相場では 25日移動平均線からのマイナス乖離が
//        最低20%、安心して買えるのは35%以上…」
//      "IN THE 2001 AND 2002 MARKET, the minimum negative deviation from the
//       25-day MA was 20%, and one could buy with confidence at 35%+..."
//
//  By December 2004 he had already watched that threshold decay to ~15% and had
//  adapted. And in ZAKZAK (2008-01-24) he said the naive version outright fails:
//
//      「地合の見極めが重要で…25日移動平均線との乖離率だけで逆張りしてもダメ」
//      "Reading the market tone is what matters — contrarian trading on 25-day
//       MA deviation ALONE is no good."
//
//  So a hardcoded -20%/-35% script is not implementing his method. It is
//  freezing a snapshot of a regime he had already abandoned. THE ADAPTATION WAS
//  THE METHOD — which is precisely what a fixed-parameter script cannot hold.
//
//  WHAT THIS SCRIPT DOES INSTEAD (the one honest idea worth coding)
//   His documented entry logic was "compare the deviation to THIS STOCK'S OWN
//   past reversal points" — thresholds empirically fitted per-stock, which is
//   why he also said 「全ての銘柄に適用できる乖離率の尺度はありません」
//   ("there is no deviation-rate measure applicable to all stocks").
//   Percentile mode implements exactly that: enter when kairi reaches its own
//   bottom k-th percentile OVER A ROLLING WINDOW FOR THIS SYMBOL. The trigger
//   therefore re-calibrates itself as regime changes — the 35%→15% decay he
//   lived through happens automatically instead of being frozen in an input.
//   Fixed mode is included ONLY so you can A/B it against the folklore version.
//
//  WHAT IS *HIS*, WHAT IS *MINE* (do not blur these)
//   HIS  (documented)     : kairi = deviation from the 25-day MA; exit as the
//                           deviation returns toward 0%; partial-exit at ~50% of
//                           entry deviation; per-stock calibrated thresholds;
//                           Bollinger -2σ/-3σ confluence; 1-3 day holds;
//                           market-tone (地合) as a mandatory precondition;
//                           long-only cash equities, no averaging down.
//   MINE (inventions)     : EVERY stop-loss below. Every default number. The
//                           time-stop as a *rule* (his 1-3 days was a
//                           description of duration, not a stated rule). The
//                           operationalization of 地合 as an index filter.
//                           Position sizing (he never stated one).
//   NOT MODELLED AT ALL   : BREADTH. He ran 30-70 concurrent positions from a
//                           600-700 name watchlist and called that breadth his
//                           edge outright (「銘柄の視野の広さ」). Pine strategies
//                           are SINGLE-SYMBOL. This script structurally cannot
//                           express the thing he said was the edge. See §16.
//
//  RSI IS DELIBERATELY ABSENT. English sources list it as a "BNF filter"; no
//  Japanese source supports it. It appears to be an SEO invention. Bollinger
//  Bands ARE supported, and are included.
//
//  DESIGN NOTES
//   * Daily bars. Long-only (his 逆張り was buying oversold cash equities).
//   * process_orders_on_close = false ⇒ signals computed on the bar close FILL
//     AT THE NEXT BAR'S OPEN. This matches the 翌日の寄り付き convention used by
//     the only serious independent backtests (nehori.com) and is honest for a
//     daily equity strategy — you cannot actually trade the close you triggered on.
//   * Every decision is gated on barstate.isconfirmed; calc_on_every_tick=false.
//   * The benchmark is read same-timeframe via f_bm() and gated on confirmation.
//
//  EXPECTED BEHAVIOUR — READ THIS OR YOU WILL MISREAD THE BACKTEST
//   Nagel (2012, "Evaporating Liquidity", RFS 25(7)) shows short-term reversal
//   returns ARE the returns to liquidity provision: strongly VIX-conditional,
//   concentrated in turmoil, competed away as capital arrives. Independent tests
//   agree — a -35% rule on Nikkei 225 constituents fired ~10 times PER YEAR
//   across 225 names over 17 years (PF 4.88), while loosening to -5/-15% raised
//   trade count 45x and collapsed PF to 1.41. THE EDGE LIVES IN THE TAIL.
//   Correct behaviour is LONG FLAT PERIODS PUNCTUATED BY CLUSTERS IN CRASHES.
//   If you tune this until it trades often, you have tuned the edge out of it.
//
//   Also note: in the most rigorous sweep found (all TSE, 1991-2019), a 5-day MA
//   at -20% performed as well as the 25-day at -35%. THE 25-DAY MA IS NOT
//   PRIVILEGED. It is one proxy for "how violent was the recent selloff". The
//   MA length is exposed as an input for exactly this reason — test 5.
//
//  DISCLAIMER (do not remove): a mechanical encoding of a PUBLICLY DESCRIBED,
//  PARTLY DISCRETIONARY method, with explicit assumptions where the sources are
//  silent or contradictory. NOT endorsed by or affiliated with BNF, who has
//  never sold a course, never managed outside money, never confirmed his own
//  name, and withdrew from public life in 2009. Educational research tool only.
//  File: BNF_Takashi_Kotegawa_Strategy_PickMyTrade.pine
//  Source dossier: pmt_bnf_kotegawa_strategy_research_2026-07-16.md
// =============================================================================
// NOTE: strategy() arguments must be compile-time CONSTANTS in Pine v6 — they
// cannot be fed from input.*() calls (CE10123 "const float expected"). Edit the
// commission/slippage literals below directly if you need different values.
strategy(
     title                   = "BNF Takashi Kotegawa Strategy [PickMyTrade]",
     shorttitle              = "BNF Kairi [PMT]",
     overlay                 = true,
     pyramiding              = 0,
     initial_capital         = 1000000,
     default_qty_type        = strategy.fixed,
     default_qty_value       = 1,                                                   // overridden per-entry — sizing is computed from i_sizePct (§6)
     calc_on_every_tick      = false,
     calc_on_order_fills     = false,
     process_orders_on_close = false,                                               // ⇒ fills at NEXT bar's open (翌日の寄り付き)
     close_entries_rule      = "ANY",
     max_bars_back           = 2000,
     commission_type         = strategy.commission.percent,
     commission_value        = 0.05,                                                // % per side — edit this literal
     slippage                = 2)                                                   // ticks — edit this literal

// =============================================================================
//  1. INPUTS
// =============================================================================

// ---- Group "Kairi (乖離率)" -------------------------------------------------
i_maLen   = input.int(25, "MA length (BNF's setting = 25)", minval = 2, maxval = 200, group = "Kairi (乖離率)", tooltip = "BNF used the 25-day MA. BUT: the most rigorous independent sweep (all TSE 1991-2019) found a 5-day MA at -20% performs as well as the 25-day at -35%. The 25 is not privileged — TEST 5.")
i_maType  = input.string("SMA", "MA type", options = ["SMA", "EMA"], group = "Kairi (乖離率)", tooltip = "Japanese 乖離率 convention is SMA. EMA offered for research only.")

// ---- Group "Entry" ----------------------------------------------------------
i_entryMode = input.string("Percentile", "Entry mode", options = ["Percentile", "Fixed"], group = "Entry", tooltip = "PERCENTILE (recommended, and the whole point of this script): trigger when kairi hits its own bottom k-th percentile over a rolling window FOR THIS SYMBOL — self-calibrating, and the closest honest reading of what BNF documented doing. FIXED: the folklore -20%/-35% constant. Included ONLY so you can A/B it and see the difference.")
i_pct       = input.float(5.0, "Percentile mode: trigger percentile", minval = 0.1, maxval = 50.0, step = 0.5, group = "Entry", tooltip = "Enter when kairi is in its bottom k% for this symbol. 5 = 'deeper than 95% of the last N bars'. LOWER = rarer + deeper (the tail is where the edge lives).")
i_lookback  = input.int(500, "Percentile mode: calibration window (bars)", minval = 50, maxval = 1500, group = "Entry", tooltip = "Rolling window for the percentile. 500 ≈ 2 years of daily bars. BNF's own universe filter required 10+ YEARS of history (~2500 bars) so the stock's reversal points were knowable — this is the mechanical echo of that.")
i_fixed     = input.float(-20.0, "Fixed mode: kairi threshold (%)", minval = -60.0, maxval = -1.0, step = 0.5, group = "Entry", tooltip = "The folklore number. He scoped -20/-35% to the 2001-02 market BY HIS OWN WORDS, and had adapted to ~15% by 2004. Sector guides for large-caps were far shallower (pharma/securities 5-10%, electronics/high-tech 10-15%).")
i_useFloor  = input.bool(false, "Also require a minimum absolute depth", group = "Entry", tooltip = "Guard for low-volatility symbols, where the bottom 5th percentile might only be -3% and is not a real dislocation. Requires BOTH the percentile AND the absolute depth.")
i_floorPct  = input.float(5.0, "Minimum absolute depth (% below MA)", minval = 0.5, maxval = 50.0, step = 0.5, group = "Entry", tooltip = "Entered as a POSITIVE number; applied as kairi <= -this.")

// ---- Group "Exit (BNF-documented)" ------------------------------------------
i_exitKairi   = input.float(0.0, "Exit when kairi returns to (%)", minval = -30.0, maxval = 20.0, step = 0.5, group = "Exit (BNF-documented)", tooltip = "HIS RULE: 「乖離率0%に戻っていく過程で売る」 — sell as deviation returns toward 0, i.e. price re-touches the MA. This is the single best-specified element of the whole method.")
i_usePartial  = input.bool(false, "Scale out at a fraction of entry deviation", group = "Exit (BNF-documented)", tooltip = "HIS DOCUMENTED VARIANT: scale out at ~50% of the entry deviation, then rotate capital into names showing deeper deviation. (The rotation half cannot be modelled single-symbol.)")
i_partialFrac = input.float(0.5, "Scale-out at this fraction of entry deviation", minval = 0.1, maxval = 0.9, step = 0.05, group = "Exit (BNF-documented)", tooltip = "0.5 ⇒ entered at -35%, scale out at -17.5%.")
i_partialQty  = input.int(50, "Scale-out size (% of position)", minval = 10, maxval = 90, group = "Exit (BNF-documented)")

// ---- Group "Risk — ⚠️ NOT BNF'S RULES, MINE" --------------------------------
i_stopMode   = input.string("ATR", "Stop mode ⚠️ my invention", options = ["ATR", "Percent", "None"], group = "Risk — ⚠️ NOT BNF'S RULES, MINE", tooltip = "⚠️ BNF HAD NO DOCUMENTED STOP. Evidence says he cut losses early and DISCRETIONARILY, with no numeric rule, and never averaged down. The circulating '5-10%' and '2% rule' figures are editorial inference — the one source that specifically investigated his stop-loss line concluded exactly that. ATR is offered because it is at least volatility-adaptive. 'None' is the literal reading of the sources and is a fast way to blow up a mean-reversion book.")
i_atrLen     = input.int(14, "ATR length", minval = 2, maxval = 100, group = "Risk — ⚠️ NOT BNF'S RULES, MINE")
i_atrMult    = input.float(3.0, "ATR stop multiple", minval = 0.5, maxval = 10.0, step = 0.5, group = "Risk — ⚠️ NOT BNF'S RULES, MINE")
i_stopPct    = input.float(10.0, "Percent stop (%)", minval = 1.0, maxval = 40.0, step = 0.5, group = "Risk — ⚠️ NOT BNF'S RULES, MINE")
i_timeStop   = input.int(10, "Time-stop (bars in trade)", minval = 1, maxval = 40, group = "Risk — ⚠️ NOT BNF'S RULES, MINE", tooltip = "⚠️ His 一泊二日 / 二泊三日 (1-3 days) was a DESCRIPTION of typical duration for his EXTREME -35% 2001-02-regime trades, not a stated rule — and not evidence for how long a shallower percentile-based signal needs to revert. FIXED BUG (was 3): a 3-bar time-stop was cutting trades before the kairi-target could fire, banking partial losses on setups that just needed more days to revert — the one source that actually backtested a working version of this (nehori.com) used 10 days and that is what produced its positive profit factor. Untick 'Enable time-stop' to disable entirely and rely on the kairi-target + hard stop only.")
i_useTimeStop = input.bool(true, "Enable time-stop", group = "Risk — ⚠️ NOT BNF'S RULES, MINE")
i_sizePct    = input.float(10.0, "Position size (% of equity)", minval = 1.0, maxval = 100.0, step = 1.0, group = "Risk — ⚠️ NOT BNF'S RULES, MINE", tooltip = "⚠️ He NEVER stated a sizing rule — no %-equity, no Kelly, no risk cap. He scaled in (「4億のうち、最初に2億」) and explicitly rejected target-driven sizing. With 30-70 concurrent positions each was ~1.5-3% of book; this script is single-symbol, so 100% here would badly misrepresent his risk. Default 10% is a compromise and is MINE.")

// ---- Group "Confluence (BNF-documented)" ------------------------------------
i_useBB    = input.bool(false, "Require Bollinger lower-band touch", group = "Confluence (BNF-documented)", tooltip = "HIS: -2σ/-3σ touch is a documented confirmation. (RSI is deliberately absent — English sources list it, no Japanese source supports it.)")
i_bbLen    = input.int(20, "Bollinger length", minval = 5, maxval = 100, group = "Confluence (BNF-documented)")
i_bbMult   = input.float(2.0, "Bollinger stdev multiple", minval = 1.0, maxval = 4.0, step = 0.5, group = "Confluence (BNF-documented)", tooltip = "2.0 = -2σ, 3.0 = -3σ. Both are documented.")

// ---- Group "Market tone / 地合 (the part he said was decisive)" -------------
i_bmMode  = input.string("Off", "Market-tone filter", options = ["Off", "Benchmark above MA", "Benchmark not in freefall"], group = "Market tone / 地合 (the part he said was decisive)", tooltip = "⚠️ HONEST TENSION, READ THIS: BNF said 地合 was decisive and that deviation ALONE fails. But he never operationalized it — this filter is MY invention. Worse, the academic evidence PULLS THE OPPOSITE WAY: Nagel (2012) shows reversal returns are HIGHEST in turmoil, because you are being paid to provide liquidity when others won't. So 'Benchmark above MA' may filter out the exact windows where the edge lives. 'Not in freefall' is the softer compromise (don't catch the knife mid-collapse). Test all three and distrust whichever one flatters the curve.")
i_bmSym   = input.symbol("TVC:NI225", "Benchmark symbol", group = "Market tone / 地合 (the part he said was decisive)", tooltip = "TVC:NI225 for Japan. Use SPY/QQQ or a sector ETF if you run this outside Japan. NEVER traded — filter only.")
i_bmMaLen = input.int(200, "Benchmark MA length", minval = 20, maxval = 400, group = "Market tone / 地合 (the part he said was decisive)")
i_bmFloor = input.float(-10.0, "Freefall floor: benchmark kairi above (%)", minval = -40.0, maxval = 0.0, step = 0.5, group = "Market tone / 地合 (the part he said was decisive)", tooltip = "Block entries while the BENCHMARK itself is deeper than this below its own MA (uses the same MA length as the symbol's kairi).")

// ---- Group "Universe filters (BNF-documented)" ------------------------------
i_minHist  = input.int(750, "Require this many bars of history", minval = 0, maxval = 3000, group = "Universe filters (BNF-documented)", tooltip = "HIS universe filter: 「過去データを10年超で確認でき」 — 10+ YEARS of verifiable history (~2500 daily bars), low bankruptcy risk, high volume. The history rule is mechanically consistent with per-stock calibration: you need long history to know where THAT stock reverses. 750 (~3y) is a usable default; 2500 is the faithful one.")
i_minTurn  = input.float(0.0, "Min turnover (close × volume), 0 = off", minval = 0, group = "Universe filters (BNF-documented)", tooltip = "HIS: high volume / liquid names only. Units are the symbol's currency — for TSE set e.g. 100000000 (¥100M, the liquidity filter used by the toushi-strategy.com study).")

// ---- Group "Alerts" ---------------------------------------------------------
i_alertsOn = input.bool(false, "Emit alert() JSON messages", group = "Alerts", tooltip = "⚠️ PICKMYTRADE CANNOT ROUTE JAPANESE EQUITIES — supported brokers are futures/US/FX only (Tradovate, Rithmic, IB, TradeStation, ProjectX, cTrader, MatchTrader, TradeLocker, Tradier). No SBI/Rakuten/Monex/Matsui, no TSE. These alerts are only actionable if you run this script on an instrument PMT actually supports. Verify any schema on a paper account first.")
i_acct     = input.string("", "Account / token", group = "Alerts")
i_pmtSym   = input.string("", "Routing symbol (blank = chart symbol)", group = "Alerts")

// =============================================================================
//  2. HELPERS
// =============================================================================

// Same-timeframe benchmark read. lookahead_off; every use is gated on
// barstate.isconfirmed, so the forming-bar value is never acted on.
f_bm(simple string _sym, series float _expr) =>
    request.security(_sym, timeframe.period, _expr, lookahead = barmerge.lookahead_off, gaps = barmerge.gaps_off)

// Kairi (乖離率) = percentage deviation of price from its moving average.
// Guarded against a zero/na MA so it never emits inf.
f_kairi(series float _px, series float _ma) =>
    (na(_ma) or _ma == 0.0) ? na : ((_px - _ma) / _ma) * 100.0

// Tick-rounded, na-guarded JSON number (never emits "NaN").
f_num(float _x) => str.tostring(math.round_to_mintick(na(_x) ? 0.0 : _x))

f_msg(string _action, float _px, string _reason) =>
    '{"account":"' + i_acct + '","symbol":"' + (i_pmtSym == "" ? syminfo.ticker : i_pmtSym) +
     '","action":"' + _action + '","price":' + f_num(_px) +
     ',"comment":"' + _reason + '","time":"' + str.tostring(timenow) + '"}'

// =============================================================================
//  3. CORE CALCULATIONS  (all ta.* called unconditionally — never inside an if,
//  which would corrupt their internal history buffers)
// =============================================================================
maSma = ta.sma(close, i_maLen)
maEma = ta.ema(close, i_maLen)
ma    = i_maType == "SMA" ? maSma : maEma
kairi = f_kairi(close, ma)

// --- Percentile calibration -------------------------------------------------
// The threshold is taken from the PRIOR bar's window ([1]) so that today's own
// extreme reading cannot drag the threshold down toward itself. Uses only
// current-and-past data — no lookahead.
pctRaw    = ta.percentile_linear_interpolation(kairi, i_lookback, i_pct)
pctThresh = pctRaw[1]

// Effective trigger, with the optional absolute-depth floor ANDed in.
baseThresh = i_entryMode == "Percentile" ? pctThresh : i_fixed
effThresh  = na(baseThresh) ? na : (i_useFloor ? math.min(baseThresh, -i_floorPct) : baseThresh)

// The trigger expressed back in PRICE terms — this is what makes an abstract
// percentile visible as a line on the chart.
trigPrice = (na(ma) or na(effThresh)) ? na : ma * (1.0 + effThresh / 100.0)

// --- Bollinger --------------------------------------------------------------
bbBasis = ta.sma(close, i_bbLen)
bbDev   = i_bbMult * ta.stdev(close, i_bbLen)
bbLower = bbBasis - bbDev

// --- ATR --------------------------------------------------------------------
atr = ta.atr(i_atrLen)

// =============================================================================
//  4. BENCHMARK / MARKET TONE (地合)
// =============================================================================
bmClose = f_bm(i_bmSym, close)
bmMa    = f_bm(i_bmSym, i_maType == "SMA" ? ta.sma(close, i_bmMaLen) : ta.ema(close, i_bmMaLen))
bmKaMa  = f_bm(i_bmSym, i_maType == "SMA" ? ta.sma(close, i_maLen)   : ta.ema(close, i_maLen))
bmValid = not na(bmClose) and not na(bmMa) and not na(bmKaMa)
bmKairi = f_kairi(bmClose, bmKaMa)

bmOk = i_bmMode == "Off" ? true : not bmValid ? false : i_bmMode == "Benchmark above MA" ? (bmClose > bmMa) : (not na(bmKairi) and bmKairi > i_bmFloor)

// =============================================================================
//  5. FILTERS
// =============================================================================
histOk = bar_index >= i_minHist
// Percentile mode additionally needs the calibration window itself to be full.
calibOk = i_entryMode == "Fixed" or (bar_index >= i_lookback + 1 and not na(pctThresh))
turnOk  = i_minTurn <= 0 or (not na(volume) and close * volume >= i_minTurn)
bbOk    = (not i_useBB) or (not na(bbLower) and close <= bbLower)
kairiOk = (not na(kairi)) and (not na(effThresh)) and kairi <= effThresh

// =============================================================================
//  6. ENTRY  (long only — his 逆張り was buying oversold cash equities)
// =============================================================================
canEnter = barstate.isconfirmed and strategy.position_size == 0 and histOk and calibOk and turnOk and bmOk and bbOk and kairiOk

// -- Trade state --
var float entryKairi = na
var float stopPx     = na
var int   entryBar   = na
var bool  partialHit = false

// Sizing is computed explicitly rather than via default_qty_type, because
// strategy() args must be compile-time constants and therefore cannot read
// i_sizePct. NOTE: strategy.entry has NO qty_percent parameter (only
// strategy.close does) — the quantity must be derived here and passed as qty.
// Priced off the signal-bar close; the actual fill is the next bar's open, so
// realised exposure drifts slightly from i_sizePct. That is honest, not a bug.
qtyCalc = (na(close) or close <= 0) ? na : (strategy.equity * i_sizePct / 100.0) / close

if canEnter and not na(qtyCalc) and qtyCalc > 0
    strategy.entry("L", strategy.long, qty = qtyCalc, comment = "kairi " + str.tostring(math.round(kairi, 1)) + "%")
    entryKairi := kairi
    partialHit := false
    if i_alertsOn
        alert(f_msg("buy", close, "ENTRY kairi=" + str.tostring(math.round(kairi, 1))), alert.freq_once_per_bar_close)

// Capture the ACTUAL fill bar and set the stop off the ACTUAL fill price.
// (Entries fill at the next bar's open, so neither is known at signal time.)
justFilled = strategy.position_size > 0 and strategy.position_size[1] == 0
if justFilled
    entryBar := bar_index
    if strategy.opentrades > 0
        entryBar := strategy.opentrades.entry_bar_index(0)
    avg = strategy.position_avg_price
    stopPx := i_stopMode == "None" ? na : i_stopMode == "ATR" ? (avg - i_atrMult * nz(atr, 0.0)) : (avg * (1.0 - i_stopPct / 100.0))
    stopPx := na(stopPx) ? na : math.round_to_mintick(stopPx)

// =============================================================================
//  7. EXITS
//     Priority: hard stop (broker-side) > BNF kairi target > scale-out >
//               time-stop. Close-based exits fill at the next bar's open.
// =============================================================================
barsIn = (strategy.position_size > 0 and not na(entryBar)) ? bar_index - entryBar : na

if barstate.isconfirmed and strategy.position_size > 0
    // ---- Protective stop ⚠️ MY invention, not his ----
    if i_stopMode != "None" and not na(stopPx)
        strategy.exit("L-stop", from_entry = "L", stop = stopPx)

    // ---- Scale-out at a fraction of entry deviation (HIS documented variant) ----
    if i_usePartial and (not partialHit) and (not na(entryKairi)) and (not na(kairi))
        partialLevel = entryKairi * (1.0 - i_partialFrac)
        if kairi >= partialLevel
            strategy.close("L", qty_percent = i_partialQty, comment = "SCALE-OUT")
            partialHit := true
            if i_alertsOn
                alert(f_msg("sell", close, "SCALE-OUT kairi=" + str.tostring(math.round(kairi, 1))), alert.freq_once_per_bar_close)

    // ---- HIS RULE: exit as deviation returns toward 0% ----
    if (not na(kairi)) and kairi >= i_exitKairi
        strategy.close("L", comment = "KAIRI-TARGET")
        if i_alertsOn
            alert(f_msg("sell", close, "KAIRI-TARGET"), alert.freq_once_per_bar_close)

    // ---- Time-stop ⚠️ MY invention (his 1-3 days was a description) ----
    else if i_useTimeStop and (not na(barsIn)) and barsIn >= i_timeStop
        strategy.close("L", comment = "TIME-STOP")
        if i_alertsOn
            alert(f_msg("sell", close, "TIME-STOP"), alert.freq_once_per_bar_close)

// ---- Teardown on the flat transition ----
if strategy.position_size == 0 and strategy.position_size[1] != 0
    entryKairi := na
    stopPx     := na
    entryBar   := na
    partialHit := false

// =============================================================================
//  8. VISUALS
// =============================================================================
plot(ma,                                     "MA (kairi basis)", color = color.new(color.orange, 0), linewidth = 2)
plot(trigPrice,                              "Kairi trigger price", color = color.new(color.red, 20), style = plot.style_linebr, linewidth = 1)
plot(i_useBB ? bbLower : na,                 "Bollinger lower", color = color.new(color.purple, 40), style = plot.style_linebr)
plot(strategy.position_size > 0 ? stopPx : na, "Active stop ⚠️ mine", color = color.new(color.red, 0), style = plot.style_linebr, linewidth = 2)

plotshape(canEnter, "Entry signal", style = shape.triangleup, location = location.belowbar, color = color.new(color.green, 0), size = size.tiny)
bgcolor(not bmOk and i_bmMode != "Off" ? color.new(color.gray, 90) : na, title = "Market-tone filter blocking")

// Status table — kairi is an oscillator and this script is overlay, so the
// live readings live here rather than in a second pane.
var table st = table.new(position.top_right, 2, 7, border_width = 1)
if barstate.islast
    okColor  = color.new(color.green, 70)
    badColor = color.new(color.red, 70)
    table.cell(st, 0, 0, "BNF Kairi [PMT]", text_color = color.white, bgcolor = color.new(color.blue, 40), text_size = size.small)
    table.cell(st, 1, 0, i_entryMode + " / MA" + str.tostring(i_maLen), text_color = color.white, bgcolor = color.new(color.blue, 40), text_size = size.small)
    table.cell(st, 0, 1, "kairi now", text_size = size.small)
    table.cell(st, 1, 1, na(kairi) ? "—" : str.tostring(math.round(kairi, 2)) + "%", text_size = size.small, bgcolor = kairiOk ? okColor : na)
    table.cell(st, 0, 2, "trigger", text_size = size.small)
    table.cell(st, 1, 2, na(effThresh) ? "—" : str.tostring(math.round(effThresh, 2)) + "%", text_size = size.small)
    table.cell(st, 0, 3, "trigger px", text_size = size.small)
    table.cell(st, 1, 3, na(trigPrice) ? "—" : str.tostring(math.round_to_mintick(trigPrice)), text_size = size.small)
    table.cell(st, 0, 4, "history", text_size = size.small)
    table.cell(st, 1, 4, str.tostring(bar_index) + " bars", text_size = size.small, bgcolor = (histOk and calibOk) ? okColor : badColor)
    table.cell(st, 0, 5, "market tone", text_size = size.small)
    table.cell(st, 1, 5, i_bmMode == "Off" ? "off" : (bmOk ? "OK" : "BLOCKING"), text_size = size.small, bgcolor = i_bmMode == "Off" ? na : (bmOk ? okColor : badColor))
    table.cell(st, 0, 6, "⚠️ breadth", text_size = size.small)
    table.cell(st, 1, 6, "NOT modelled", text_size = size.small, bgcolor = badColor)

// =============================================================================
//  9. THE LIMITATION THAT MATTERS MOST — READ BEFORE TRUSTING ANY EQUITY CURVE
// =============================================================================
//  This script is SINGLE-SYMBOL. BNF ran 30-70 concurrent positions drawn from a
//  600-700 name watchlist, and named that breadth as the edge itself: comparing
//  a trader watching 10 stocks against one watching 100, he said the latter
//  should substantially outperform (「銘柄の視野の広さ」). His documented
//  scale-out rule even says to ROTATE the freed capital into names showing
//  deeper deviation — a cross-sectional instruction that has no meaning on one
//  chart. Pine strategies cannot express any of this.
//
//  So this script tests THE SIGNAL, not THE SYSTEM. A good equity curve here
//  means "the trigger has edge on this symbol", NOT "this is what BNF did".
//  Reproducing the actual method requires a screener + portfolio backtester
//  (Python / Protra), point-in-time universe data, and delisted symbols —
//  which TradingView does not have. TSE:4753 (Livedoor) is a hard 404, so any
//  TradingView-based Japanese backtest is survivorship-biased BY CONSTRUCTION,
//  in exactly the direction a buy-the-crash strategy is biased. Treat every
//  Japanese-equity result from this script as an OPTIMISTIC upper bound.
//
//  SUGGESTED TEST SET (per the dossier §6):
//    AMEX:EWJ   — the ONLY Japan proxy with full 2000-2008 history (inception
//                 1996-03-12). Large-cap USD-unhedged beta: right era, wrong
//                 universe. Best available "did this work in BNF's era" probe.
//    TSE:7203 etc. — modern liquid TSE names. Right market, wrong era.
//                 ⚠️ FIRST verify how far back TradingView's TSE daily data
//                 actually goes: load the symbol, zoom to the first bar. This is
//                 undocumented and is the single biggest unresolved risk.
//    TSE:2337   — ⚠️ TICKER TRAP. This is ICHIGO now. The Asset Managers that
//                 BNF bought in Feb 2006 at -37% deviation (his one named,
//                 dated, codeable example) was absorbed. Same code, different
//                 company. TSE:2462 is likewise LIKE, Inc., not the 2005 J-Com.
//    Small-cap US/JP names — right mechanics, different market. Honest as a
//                 "does the logic generalize" test, dishonest as "BNF's method".
//
//  DO NOT bother trying to backtest the J-Com trade. It was resolved by a Japan
//  Securities Clearing Corporation FORCED CASH SETTLEMENT at ¥912,000/share,
//  announced four days after the fat-finger — an administrative decision, not a
//  market print. Backtesting it would model a regulator, not an edge.
// =============================================================================
How to Automate It With PickMyTrade
Once you have this script running on a chart with a live signal, TradingView’s alert() calls in the script are already formatted as PickMyTrade-compatible JSON — set your TradingView alert to “Any alert() function call,” frequency “Once Per Bar Close,” and point the webhook at your PickMyTrade endpoint.
- Backtested here (not executable via PickMyTrade): crypto pairs — the instruments actually backtested above. Apply this logic to a PickMyTrade-supported futures/forex instrument for live execution.
- Not supported: Japanese equities. PickMyTrade has no Japanese broker integration (no SBI, Rakuten, Monex, Matsui, or direct TSE routing), so the “authentic” small-cap-Japan version of this method can’t be automated through PickMyTrade at all — one more reason the crypto backtest, not a Japanese-equity one, is the honest deliverable here.
Always verify your exact webhook payload schema on a paper/demo account before connecting a live funded account.
Ready to automate a mean-reversion signal without babysitting charts?
Connect TradingView to your broker with PickMyTrade →FAQ
Is this really BNF’s trading strategy?
No — and we want to be direct about that. This is our mechanical interpretation of his publicly reported approach, built where the sources actually support a rule and clearly labelled where we had to invent one (stops, sizing, time-stop). BNF has never published a system and is not affiliated with this content in any way.
Why isn’t this profitable on stocks or gold?
We haven’t found a clean stock backtest that clears a reasonable sample-size bar yet — the underlying research suggests this edge is a rare, tail-concentrated phenomenon (real profit factor tests on Japanese equities show it firing roughly 10 times a year across an entire 225-stock index). Gold specifically failed because its mean-reversion is driven by macro factors, not the panic-selling mechanism this method targets.
Can I run this on Japanese stocks like BNF actually traded?
Only for research — PickMyTrade cannot route orders to Japanese brokers or the Tokyo Stock Exchange, so you could backtest it there but not automate it live through this platform. Note also that several of BNF’s most-cited historical trades (Livedoor, the original J-Com listing) are on delisted symbols that no longer exist on TradingView at all.
What does “kairi” mean?
乖離率 (kairi-ritsu) is Japanese for “deviation rate” — specifically, how far price has strayed from its moving average, expressed as a percentage. It’s a real, decades-old Japanese technical indicator, not something invented for this article.