A multi-model intraday momentum system built on Power of Three (PO3), VWAP dynamics, and order flow approximation — fully automated on TradingView with PickMyTrade.
Umar Ashraf Strategy [PickMyTrade] brings one of the most-followed intraday trading methodologies to TradingView as a fully automated Pine Script v6 strategy. Inspired by Umar Ashraf’s Power of Three (PO3) framework, it combines liquidity sweep detection, VWAP reclaim setups, and an order flow approximation engine to identify high-probability momentum entries during the US morning session.
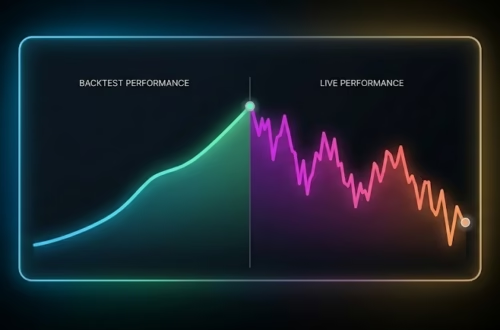
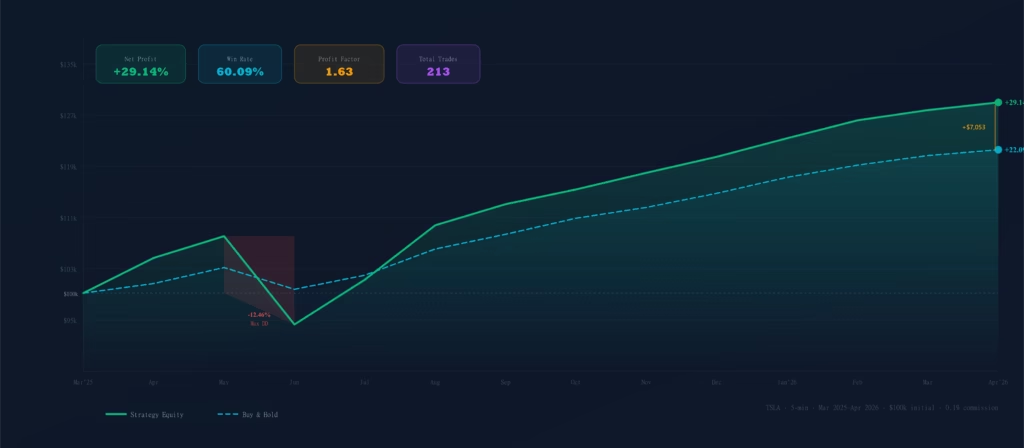
Backtested on TSLA 5-minute charts from March 2025 through April 2026, the strategy delivered +$29,138 net profit (+29.14%) on a $100,000 base — outperforming buy & hold by over $7,000 with a controlled 12.46% max drawdown. This post breaks down every component: the five trading models, the order flow engine, the risk management rules, and exactly how to automate it with PickMyTrade.
After reading this, you will understand:
- What Power of Three is — and why institutional traders use liquidity sweeps to trap retail positions
- How each of the 5 trading models fires — PO3 sweep, VWAP reclaim, absorption reversal, and EMA pullback
- How order flow is approximated in Pine Script — Volume Delta, CVD, delta divergence, and absorption detection
- The exact optimized settings for TSLA on the 5-minute timeframe
- How to automate signals end-to-end with PickMyTrade for hands-free execution
What Is Power of Three (PO3) — Umar Ashraf’s Core Edge
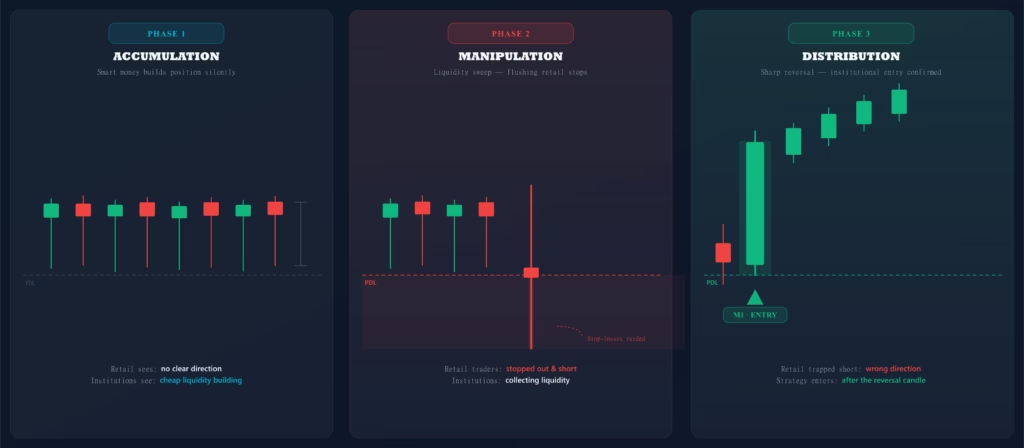
Power of Three is a concept rooted in ICT (Inner Circle Trader) and Smart Money Concepts (SMC) methodology, widely popularized in retail trading education by Umar Ashraf. The premise is that institutional participants structure price movement in three deliberate phases:
Phase 1 — Accumulation Price consolidates near a key level (PDH, PDL, PMH, PML). Smart money quietly builds a position while retail traders see a ranging market with no clear direction.
Phase 2 — Manipulation Price wicks sharply through the key level, triggering retail stop-losses and inducing breakout traders to enter the wrong direction. This is the “fakeout” or liquidity sweep.
Phase 3 — Distribution With retail positions flushed and liquidity collected, price reverses sharply in the intended direction. This displacement candle is the entry signal for the PO3 model.
The key insight: key levels (PDH, PDL, PMH, PML) are not support/resistance to trade with — they are liquidity pools that institutions sweep before reversing. The strategy profits by entering after the sweep, not before it.
The 5 Trading Models — Entry Logic Explained
This strategy fires entries through five distinct models, each designed for a different market condition during the US morning session. All five share the same global filters: ADX trend confirmation, EMA stack alignment, long-term EMA 50 trend filter, daily trade limits, and order flow layer confirmation.
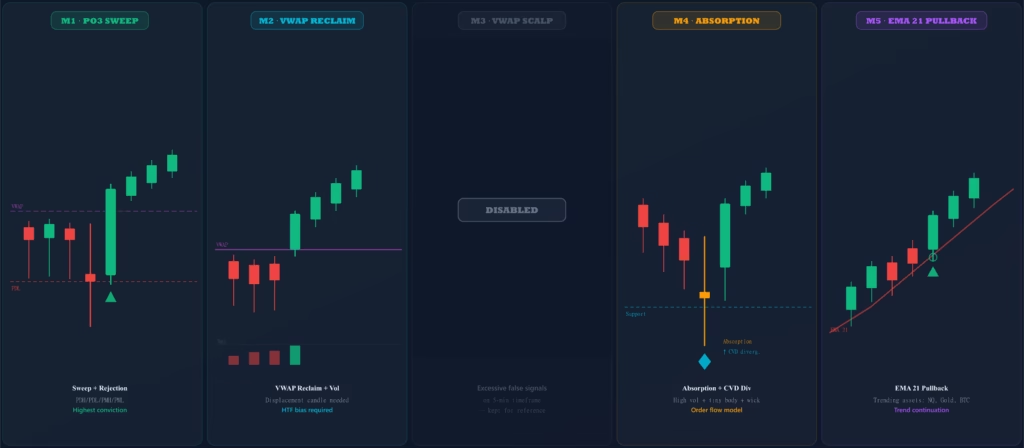
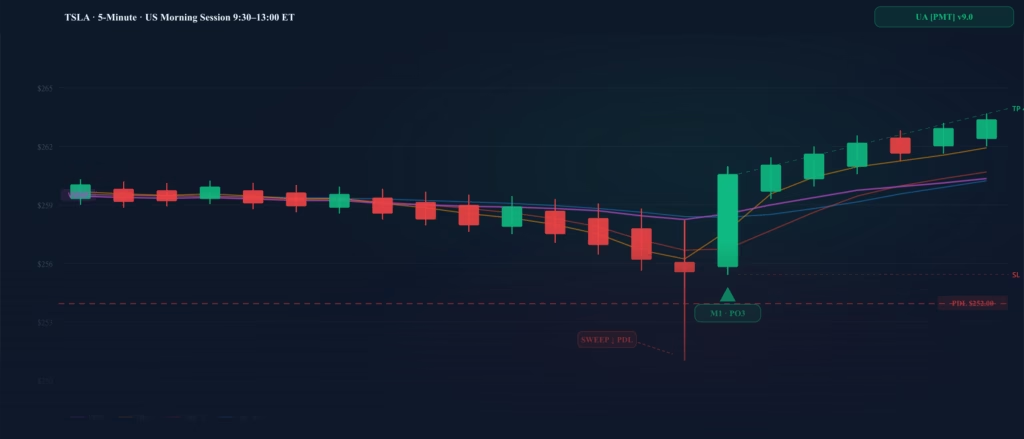
M1 — Power of Three (PO3) Sweep & Rejection
The highest-conviction setup in the strategy. Detects a confirmed liquidity sweep of PDH, PDL, PMH, or PML within the lookback window, followed by a sharp rejection candle that closes back through the level. The market fakes out weak hands, then reverses with volume.
- Trigger: Price sweeps key level (within sweep margin %) then a strong body candle closes back above/below it
- Confirmation: Close above VWAP (longs) or below VWAP (shorts) + EMA bull/bear stack
- Order flow: Bar delta must confirm direction (positive delta for longs, negative for shorts)
- Stop loss: Below the actual sweep candle’s wick (structural) + 0.2 ATR buffer
- Take profit: 50% PDH–PDL midpoint or 4R target (whichever applies)
HTF bias can be neutral on M1 — the sweep itself is the directional signal.
M2 — VWAP Reclaim with Displacement
Price reclaims VWAP after being below (longs) or above (shorts) it for the reclaim lookback window, confirmed by a strong displacement candle with institutional volume. Requires HTF bullish or bearish bias alignment — neutral bias is rejected on M2.
- Trigger: Price was below/above VWAP for N bars, then closes back through with a strong body candle
- Volume: Requires strong volume (1.5× 20-bar average) — low-conviction reclaims are filtered out
- Candle quality: Displacement candle — upper wick < 50% of body, lower wick < 70% of body
- Time: Not before 9:45 AM ET (first 15 minutes excluded to avoid open noise)
M3 — VWAP Scalp (DISABLED)
Included in the code but disabled — generates excessive false signals on the 5-minute timeframe. Kept for reference and future testing on higher timeframes.
M4 — Absorption Reversal (Order Flow Model)
This is the closest Pine Script equivalent to Umar’s footprint chart reads. It identifies absorption candles — high volume bars with a tiny body and long wick at key structural levels — combined with CVD delta divergence. When big money absorbs aggressive orders at a level, it signals exhaustion before reversal.
- Trigger: Volume > 2× average + body < 0.2 ATR + long wick at PDL/PML or VWAP support
- CVD filter: Price makes new low but CVD doesn’t confirm = selling exhaustion (bullish divergence)
- Bias required: HTF must be bullish (longs) or bearish (shorts) — no neutral bias on M4
- Best on: High-volume TSLA/NQ opens when strong volume appears at structural levels
M5 — EMA 21 Pullback (Trend Continuation)
Designed for trending assets (NQ, Gold, BTC) where price rarely sweeps key levels and M1 seldom fires. Catches pullbacks to EMA 21 during an active trend with EMA stack and bias confirmation.
- Trigger: Price dips to touch EMA 21 (within 0.2%) then closes bullish above it (longs) or bearish below it (shorts)
- Requires: EMA 9 > EMA 21 and price above EMA 9 for longs (reversed for shorts)
- ADX: Market must be trending (ADX > threshold) — no entries in choppy conditions
Order Flow Engine — Approximating Footprint Charts in Pine Script
True order flow analysis requires Level 2 data, DOM (Depth of Market), and footprint charts — none of which are accessible in TradingView Pine Script. This strategy bridges that gap using six volume-based approximations that collectively replicate the directional insights Umar draws from his footprint chart:
1. Volume Delta via CLV (Close Location Value) Estimates what percentage of each bar’s volume was buying vs. selling. CLV = ((close − low) − (high − close)) / (high − low). Ranges from −1 (all selling) to +1 (all buying). Bar delta = volume × CLV.
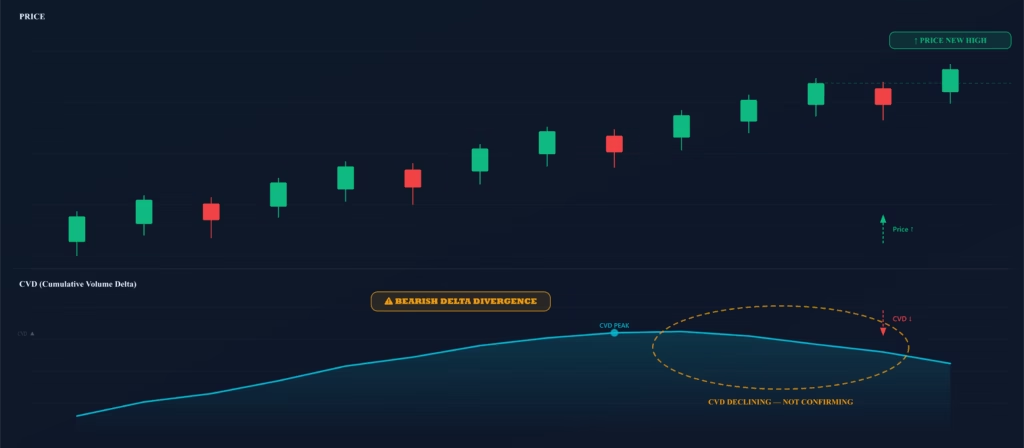
2. Cumulative Volume Delta (CVD) Running sum of bar delta. A rising CVD signals sustained net buying pressure; falling CVD signals net selling. The strategy compares CVD fast EMA (5) vs slow EMA (20) for trend direction.
3. Delta Divergence Price makes a new 5-bar high but CVD doesn’t confirm = buying exhaustion (bearish divergence). Price makes a new 5-bar low but CVD doesn’t confirm = selling exhaustion (bullish divergence). Used as a filter on M4 entries.
4. Absorption Detection High volume + tiny body (≤ 0.2 ATR) + long wick at a key level. Bullish absorption: long lower wick at PDL/PML/VWAP support. Bearish absorption: long upper wick at PDH/PMH/VWAP resistance. Plotted as cyan diamonds on the chart.
5. Block Trade Detection Volume bars exceeding 2.5× the 20-bar average = institutional-sized orders. Bullish block (green square) or bearish block (red square) plotted as awareness markers. Adds conviction weight when combined with other signals.
6. Volume Imbalance Buy % = buy volume ÷ total volume per bar. When buy% > 60% threshold = bullish imbalance. Adds directional weight to M1 and M2 entries when extreme imbalance aligns with trade direction.
Important Limitation: These approximations are derived from OHLCV data only. They improve signal quality significantly but are not a replacement for real footprint analysis. Each asset requires independent optimization and verification.
Backtest Results — TSLA | 5-Min | Mar 2025–Apr 2026
Strategy tested on TSLA (Tesla) 5-minute chart from March 2025 through April 2026. Initial capital: $100,000. Commission: 0.1% per side. Slippage: 2 ticks. Partial TP at 1R (50% of position) enabled. 4:1 R:R target.
| Metric | Value |
|---|---|
| Net Profit | +$29,138 (+29.14%) |
| Buy & Hold Return | $22,085 (22.09%) |
| Strategy Outperformance | +$7,053 vs Buy & Hold |
| CAGR | 27.82% |
| Total Trades | 213 |
| Win Rate | 60.09% |
| Profit Factor | 1.63 |
| Avg Win / Avg Loss | $588 / $543 |
| Largest Win / Loss | $2,338 / $1,788 |
| Max Drawdown | 12.46% |
| Sharpe Ratio | 0.54 |
| Sortino Ratio | 1.40 |
| Commission Paid | $16,944 |
Initial capital: $100,000 · Commission: 0.1% · Slippage: 2 ticks · Partial TP at 1R · 4:1 R:R
Optimized Settings for TSLA 5-Minute
The settings below produced the backtest results shown above. Every asset requires independent optimization — these are not universal defaults, they are TSLA-specific values found through systematic testing.
| Setting | Value |
|---|---|
| Sweep Lookback | 10 bars |
| Sweep Margin | 0.5% |
| ADX Length | 11 |
| ADX Min Strength | 21 |
| R:R Target | 4.0 |
| VWAP Reclaim Lookback | 5 bars |
| Min Body (ATR ×) | 1.0 |
| Volume Multiplier | 1.3 |
| SMT Divergence | ON (QQQ) |
| Max Trades / Day | 10 |
| Cooldown | 7 bars |
| Partial TP at 1R | ON |
| Breakeven | OFF |
| Entry Window | 9:30–13:00 ET |
Risk Management Rules
Every entry in this strategy is gated by a multi-layer risk framework. No trade fires unless all conditions below are met.
Structural Stop Loss Stop placed below the 3-bar swing low/high + 0.2–0.3 ATR buffer. Capped at 3× ATR maximum to prevent unusually wide stops. For M1 sweeps, the stop is placed below the sweep candle’s actual wick.
Partial TP at 1R 50% of the position exits at 1R profit (TP1). The remaining 50% runs to the full 4R target or the 50% PDH–PDL midpoint on M1 setups. Locks in profit while letting winners run.
Daily Limits & Cooldown Maximum trades per day cap + minimum N-bar cooldown between any two entries prevents over-trading. A daily max loss circuit breaker (5% of equity) halts all entries for the remainder of the session.
EOD Flat Close All open positions are automatically closed at 15:55 ET regardless of P&L. Entries are only allowed within the 9:30–13:00 ET morning session window.
Entry Filters — Avoiding Choppy & Counter-Trend Markets
| Filter | Logic | Purpose |
|---|---|---|
| ADX Trend Strength | ADX > 21 | Blocks entries in ranging/choppy conditions |
| EMA 9/21 Intraday Stack | EMA 9 > EMA 21 for longs | Ensures entries in direction of intraday momentum |
| EMA 50 Long-Term Filter | Close > EMA 50 for longs | Prevents counter-trend entries |
| HTF 4H Structural Bias | Higher high/low on 4H = bullish | Aligns entries with higher-timeframe structure |
| SMT Divergence (Optional) | TSLA vs QQQ non-confirmation | Detects institutional non-confirmation |
| Session Window | 9:30–13:00 ET only | Captures highest-liquidity morning session only |
Asset Compatibility & Recommended Markets
The strategy auto-detects the asset type (stock, futures, forex, crypto) and adjusts session windows accordingly. The recommended timeframe across all assets is 5-minute.
Stocks (TSLA, NVDA, AAPL) Optimized for volatile momentum stocks. Use percent-of-equity sizing. Session filter auto-sets to 9:30–13:00 ET. Volume filter active.
Futures (NQ, ES, Gold, Silver) Enable Fixed Qty mode and set contracts manually. Volume filter bypassed (futures volume is reliable). EMA 21 pullback (M5) is especially effective on trending NQ sessions.
Forex Volume filter bypassed. Session auto-sets to London open (8:00 AM ET). Works well on EURUSD and GBPUSD with appropriate lot sizing.
Crypto (BTC, ETH) Session filter disabled (24/7 market). EOD close disabled. M5 EMA pullback performs well during trending crypto sessions. Adjust sweep margin % for higher crypto volatility.
Automate the Umar Ashraf Strategy with PickMyTrade
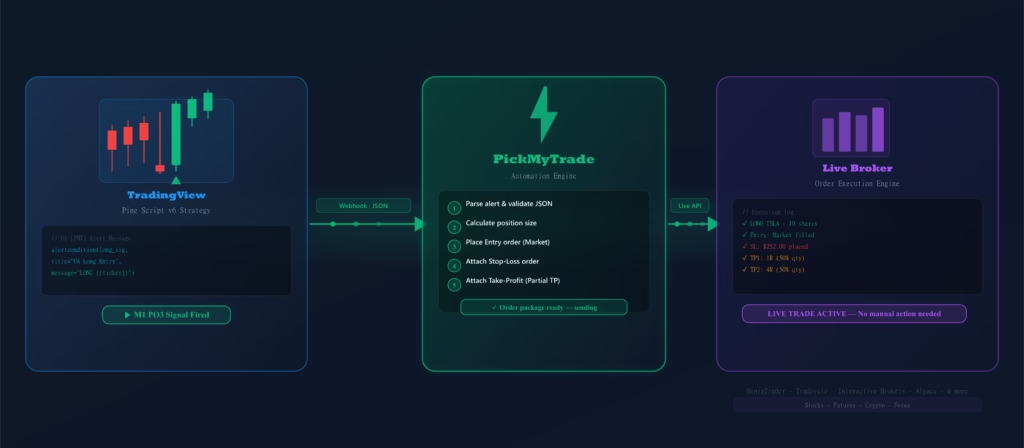
This strategy includes built-in TradingView alertconditions for every signal type — long entries, short entries, absorption markers, and delta divergence. Once you have confirmed the strategy on your asset, PickMyTrade handles the execution automatically without any manual intervention.
Step 1 — Add to TradingView Open the strategy on TradingView, add it to your 5-minute chart, and apply your optimized settings for your asset.
Step 2 — Connect PickMyTrade Link your broker to PickMyTrade. Supports prop firm accounts, futures, stocks, and crypto brokers.
Step 3 — Set Alerts & Go Live Create TradingView alerts on the Long/Short entry conditions. PickMyTrade fires orders in real time — entry, SL, and TP placed automatically.
TradingView Alert Payload (JSON)
For prop firm or advanced broker setups, use this structured JSON payload in your TradingView alert message:
{
    "symbol": "NQ",
    "date": "{{timenow}}",
    "data": "{{strategy.order.action}}",
    "quantity": "{{strategy.order.contracts}}",
    "risk_percentage": 0,
    "price": "{{close}}",
    "tp": 0,
    "percentage_tp": 0,
    "dollar_tp": 0,
    "sl": 0,
    "dollar_sl": 0,
    "percentage_sl": 0,
    "trail": 0,
    "trail_stop": 0,
    "trail_trigger": 0,
    "trail_freq": 0,
    "update_tp": false,
    "update_sl": false,
    "breakeven": 0,
    "token": "your_token_here",
    "pyramid": true,
    "reverse_order_close": false,
    "account_id": "your_account_id",
    "multiple_accounts": [
        {
            "token": "your_token_here",
            "account_id": "FFFF",
            "risk_percentage": 0,
            "quantity_multiplier": 1
        }
    ]
}
The strategy gives you the signal. PickMyTrade makes sure it executes without fail — every time, at the right size, with the right SL and TP.
Frequently Asked Questions
What is the Umar Ashraf Strategy based on?
It is a multi-model intraday strategy inspired by Umar Ashraf’s trading methodology, which centers on Power of Three (PO3) — a Smart Money Concepts framework that trades liquidity sweeps of key daily and weekly levels. The Pine Script implementation adds VWAP dynamics, order flow approximation, and systematic risk management on top of these core concepts.
Can I use this on markets other than TSLA?
Yes. The strategy is compatible with stocks, futures (NQ, ES, Gold, Silver), forex, and crypto. The asset type is auto-detected and session windows adjust automatically. However, the optimized settings shown here are specific to TSLA on the 5-minute timeframe. Every asset requires its own independent optimization. Do not apply TSLA settings to NQ or BTC without re-testing.
Why is the Sharpe Ratio only 0.54 if the net profit is strong?
The Sharpe Ratio measures risk-adjusted return relative to volatility. Intraday strategies on volatile instruments like TSLA naturally produce high trade-to-trade variance, which depresses the Sharpe Ratio even when absolute returns are healthy. The Sortino Ratio of 1.40 — which only penalizes downside volatility — gives a better picture of the strategy’s actual risk profile. A Sortino above 1.0 is generally considered acceptable for intraday momentum systems.
Does this strategy access real order flow or footprint data?
No. TradingView Pine Script cannot access Level 2 DOM, tape data, or footprint charts. This strategy approximates order flow using volume delta (CLV method), cumulative volume delta (CVD), absorption detection, and delta divergence all derived from OHLCV data. This produces directional bias information that improves signal quality meaningfully, but it is not a substitute for real footprint analysis.
What does "partial TP at 1R" mean in practice?
When the trade reaches 1× your initial risk in profit, 50% of the position is automatically closed at that level. The remaining 50% continues to the full 4R target. This approach locks in profit on the initial risk while giving the second half of the position room to capture a larger move.
How do I automate this strategy for live trading?
Add the strategy to your TradingView chart, configure your settings, then create TradingView alerts on the UA Long Entry and UA Short Entry alertconditions. Connect PickMyTrade to your broker, paste the JSON payload into the alert message, and PickMyTrade will place every entry, stop-loss, and take-profit automatically in real time.
Start Trading the Umar Ashraf Strategy
The Umar Ashraf Strategy [PickMyTrade] is available now as a public Pine Script v6 strategy on TradingView. Add it to your 5-minute chart, apply the optimized settings for your asset, forward-test for a minimum of 30 trades, then automate execution with PickMyTrade.
- 5 entry models — PO3 sweep, VWAP reclaim, absorption reversal, EMA pullback
- Full order flow engine — Volume Delta, CVD, absorption, delta divergence, block detection
- Hard-coded risk framework — structural SL, partial TP, daily limits, EOD flat close
- Multi-asset compatible — stocks, NQ/ES futures, forex, crypto
- +29.14% TSLA backtest (Mar 2025–Apr 2026) with 60% win rate and 1.63 profit factor
Disclaimer: Past performance does not guarantee future results. All backtest results shown are hypothetical and based on historical data with the benefit of hindsight. The settings shown are optimized for TSLA and may not be suitable for other assets without independent optimization. This strategy is provided for educational and informational purposes only. Trading involves substantial risk of loss. Always conduct your own due diligence and consult a qualified financial advisor before risking real capital. © PickMyTrade
You may also like:
ZAMCO ICT Strategy: A Complete Guide to Liquidity Sweeps, Market Structure Shifts & Fair Value Gaps
JadeCap ICT Silver Bullet Strategy: Complete Guide for TradingView Traders
Fabio Valentini Pro Scalper: Advanced Order Flow Trading Strategy for NASDAQ Scalping