A rigorous examination of robustness testing methods for algorithmic trading strategies, drawing on established quantitative finance research and empirical evidence.
Introduction: The Persistent Challenge of Backtest Overfitting
Algorithmic trading strategies frequently demonstrate strong performance in historical simulations (backtests) but fail to replicate those results in live or out-of-sample environments. This discrepancy arises primarily from overfitting: the strategy exploits noise or sample-specific patterns in historical data rather than persistent, economically meaningful signals.
Empirical studies highlight the severity of this issue. A large-scale analysis of 888 algorithmic strategies developed on the Quantopian platform (with at least six months of true out-of-sample performance) found that in-sample metrics, such as the Sharpe ratio, exhibited very low predictive power for out-of-sample results (R² < 0.025). Higher-order moments (e.g., volatility, maximum drawdown) and portfolio features (e.g., hedging) showed greater relevance. Notably, strategies subjected to more extensive backtesting displayed larger performance gaps between in-sample and out-of-sample periods, consistent with overfitting induced by extensive parameter exploration.
Professional quantitative practitioners address this through multi-layered validation frameworks that prioritize out-of-sample generalization over in-sample optimization.
Understanding Backtest Overfitting

Backtest overfitting occurs when a strategy captures idiosyncratic noise rather than repeatable market inefficiencies. Mathematically, observed returns can be decomposed as:
Returns = Signal + Noise
A robust strategy exploits the signal component; an overfit one fits the noise.
Key drivers include:
- High-dimensional parameter spaces — Testing thousands or millions of combinations guarantees spurious high performers under random conditions.
- Data-snooping — Iterative adjustments informed by backtest results effectively train on the test set.
- Biases in data — Survivorship (excluding failed assets), look-ahead (using future information), and selection (reporting only winners).
Overfitting is exacerbated in retail and smaller-scale development due to limited computational constraints on testing breadth and lack of strict separation protocols.
Common Sources of Overfitting
- Parameter Overfitting
Exhaustive optimization yields “optimal” values that are statistically fragile. - Data-Snooping Bias
Repeated hypothesis testing without pre-specification inflates apparent significance. - Survivorship Bias
Datasets omitting delisted securities inflate equity or index performance. - Look-Ahead Bias
Decisions incorporating information unavailable at the decision point (e.g., using current-bar close in entry logic). - Selection Bias / Cherry-Picking
Reporting only successful variants from many tested strategies. - Regime-Specific Fit
Performance tied to particular market conditions (e.g., bull vs. bear, high vs. low volatility). - Execution Assumptions
Backtests assuming zero slippage, perfect fills, and unlimited liquidity overestimate realizable returns.
Core Robustness Testing Framework

Institutional validation typically employs layered tests to isolate genuine edges.
1. Walk-Forward Optimization (WFO)
WFO simulates real-world deployment by optimizing on in-sample windows and testing unchanged on subsequent out-of-sample periods, rolling forward.
Walk-Forward Efficiency (WFE) = (Average Out-of-Sample Return) / (Average In-Sample Return)
Typical thresholds (empirical benchmarks):
- > 70%: Strong generalization.
- 50–70%: Acceptable with monitoring.
- < 50%: Likely overfitting.
Rolling windows suit regime-shifting markets; anchored windows suit more stable ones.
2. Monte Carlo Simulation
Resamples trade sequences (preserving P&L) to estimate outcome distributions under alternative orderings.
Focus on tail risks:
- P95 maximum drawdown (95th percentile worst-case).
- Position sizing should target P95 drawdown, not backtest value.
Extensions include trade skipping (simulating missed signals) and execution degradation (e.g., 0.1–0.3% slippage per round-trip).
3. Parameter Sensitivity Analysis
Sweep parameters around optima to identify plateaus (robust) vs. cliffs (overfit).
Parameter Stability Score — Proportion of variations (±10–20%) remaining profitable (e.g., >70–80% indicates robustness).
Visual tools: Heatmaps for two-parameter combinations; line plots for single sweeps.
4. Probability of Backtest Overfitting (PBO)
Developed by Bailey, Borwein, López de Prado, and Zhu (2015), PBO estimates the probability that the selected strategy outperforms alternatives due to chance.
Implemented via Combinatorially Symmetric Cross-Validation (CSCV):
- Split data into segments.
- Optimize on one, validate on another.
- Compute frequency with which top in-sample performer underperforms out-of-sample.
Interpretation:
- < 10–20%: Low risk.
- > 50%: High probability of overfitting.
5. Deflated Sharpe Ratio (DSR)
Developed by Bailey and López de Prado (2014), DSR adjusts observed Sharpe for multiple testing, non-normality, and sample length.
It deflates the ratio to account for expected maximum Sharpe under null (random) strategies across trials.
Higher DSR indicates performance unlikely due to chance.
6. Strict Out-of-Sample Validation
Reserve untouched data (e.g., 20–30%) for a final, one-time test post-development.
Rules:
- No peeking or adjustment.
- Minimum trades (e.g., 30+) for statistical power.
- Diverse regimes in hold-out period.
Failure here overrides positive prior tests.
Practical Implementation Considerations

- Data Quality — Use point-in-time, survivorship-free datasets.
- Execution Realism — Incorporate slippage, commissions, and latency in simulations.
- Simplicity Preference — Favor low-parameter strategies; complexity often signals overfitting.
- Pipeline — Automate WFO, Monte Carlo, sensitivity, PBO/DSR calculations for efficiency.
Conclusion: Toward Reliable Strategy Deployment
Backtest overfitting remains a primary reason for live underperformance in systematic trading. Rigorous, multi-layered validation emphasizing out-of-sample generalization, tail-risk awareness, and statistical adjustments substantially improves the odds of identifying persistent edges.
While no framework guarantees future success, these methods align development with professional standards and reduce reliance on illusory historical results. Practitioners should prioritize killing weak candidates early and sizing conservatively based on worst-case simulations.
For further reading:
- Bailey, Borwein, López de Prado, Zhu (2015): “The Probability of Backtest Overfitting” (Journal of Computational Finance).
- Bailey, López de Prado (2014): “The Deflated Sharpe Ratio” (Journal of Portfolio Management).
- López de Prado et al. (Quantopian study, 2016): Empirical evidence on backtest vs. out-of-sample performance.
From Validation to Live Execution: Integrating with PickMyTrade
Once a trading strategy has passed rigorous validation through walk-forward testing, Monte Carlo simulations, and strict out-of-sample evaluation the next step is consistent execution in live markets.
At this stage, traders should first convert their logic into a TradingView strategy. This ensures:
- Clear, rule-based signal generation
- Alignment between backtest and live conditions
- Elimination of discretionary decision-making
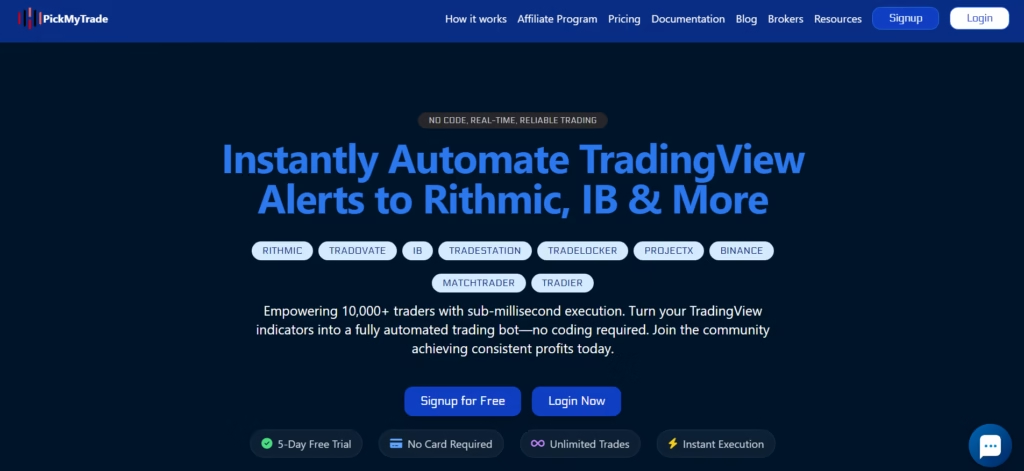
With a validated TradingView strategy in place, PickMyTrade enables seamless automation by executing trades directly from strategy alerts.
This creates a reliable workflow:
Research → Validate → Convert to TradingView Strategy → Automate → Monitor
Beyond TradingView: JSON-Based Execution for Advanced Setups
While TradingView strategies are the most straightforward path, PickMyTrade also supports direct JSON-based execution, making it suitable for more advanced or custom-built systems (e.g., Python-based models, external signal engines).
For example, a trade instruction can be sent in JSON format:
This allows traders to:
- Integrate Python or algorithmic models directly
- Send signals from external systems without TradingView
- Manage multiple accounts and risk configurations programmatically
A Structured Deployment Approach
By combining robust validation with flexible execution paths, traders can follow a disciplined pipeline:
Validate → Convert (TradingView or Code) → Automate via PickMyTrade → Monitor & Refine
PickMyTrade, therefore, acts as the execution layer—ensuring that well-tested strategies are deployed consistently, whether signals originate from TradingView or custom-built systems.
You may also Like:
Algorithmic Trading Overfitting: Why Backtests Fail in Live Markets
How to Use Clawdbot for Creating TradingView Strategies
Fabio Valentini Pro Scalper: Advanced Order Flow Trading Strategy for NASDAQ Scalping