
Introduction
If you’ve spent any time on TradingView, you’ve likely encountered LazyBear’s Squeeze Momentum Indicator – one of the most popular indicators on the platform, based on John Carter’s TTM Squeeze concept from his book “Mastering the Trade.”
At PickMyTrade, we took LazyBear’s excellent indicator and transformed it into a complete, automated trading strategy with an optimized trend filter. The difference? An indicator shows you information, but a strategy generates actual buy and sell signals with automated position management.
In this post, we’ll show you the real performance data from our optimized strategy version, tested across stocks, crypto, and forex pairs.
From Indicator to Strategy: What We Added
LazyBear’s Original Indicator provides:
- Squeeze detection (black, gray, and blue crosses)
- Momentum histogram with color coding
- Visual reference for manual trading decisions
Our Optimized Strategy Version includes:
- All the core squeeze momentum logic from LazyBear’s indicator
- 50-period MA trend filter to reduce false signals
- Automated entry and exit signals
- Position management (auto-closes opposite positions)
- Backtestable performance metrics
- Ready for automation via TradingView alerts
The key enhancement is the trend filter. By only taking long trades when price is above the 50 MA and short trades when price is below it, we’ve significantly improved the win quality and risk-adjusted returns.
Understanding Profit Factor: The Key Metric
Before diving into the results, let’s talk about one of the most important performance metrics: Profit Factor.
What is Profit Factor?
Profit factor is the ratio of gross profit to gross loss. In simple terms, it tells you how much money you make for every dollar you lose.
Profit Factor = Gross Profit / Gross Loss
For example:
- A profit factor of 1.5 means for every $1 you risk, you make $1.50
- A profit factor of 2.0 means for every $1 you risk, you make $2.00
- A profit factor above 1.0 indicates a profitable strategy
- A profit factor above 1.5 is generally considered good
- A profit factor above 2.0 is excellent
This metric is crucial because it shows the strategy’s efficiency in generating profits relative to losses, regardless of win rate.
Backtest Results: Real Performance Across Markets
We’ve tested our optimized Squeeze Momentum Strategy on multiple instruments across different timeframes. Here’s what the data shows:
Cryptocurrency – 15 Minute Timeframe
XRP/USD (15min)
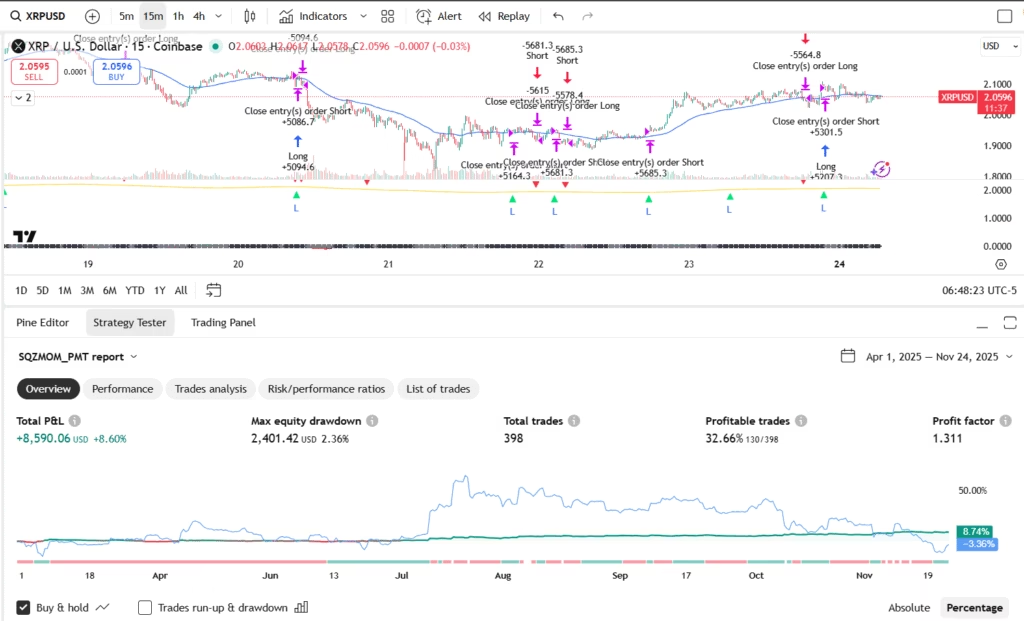
- Total P&L: +$8,590.06 (+8.60%)
- Max Drawdown: $2,401.42 (2.36%)
- Total Trades: 398
- Win Rate: 32.66%
- Profit Factor: 1.311
SOL/USDT (15min)
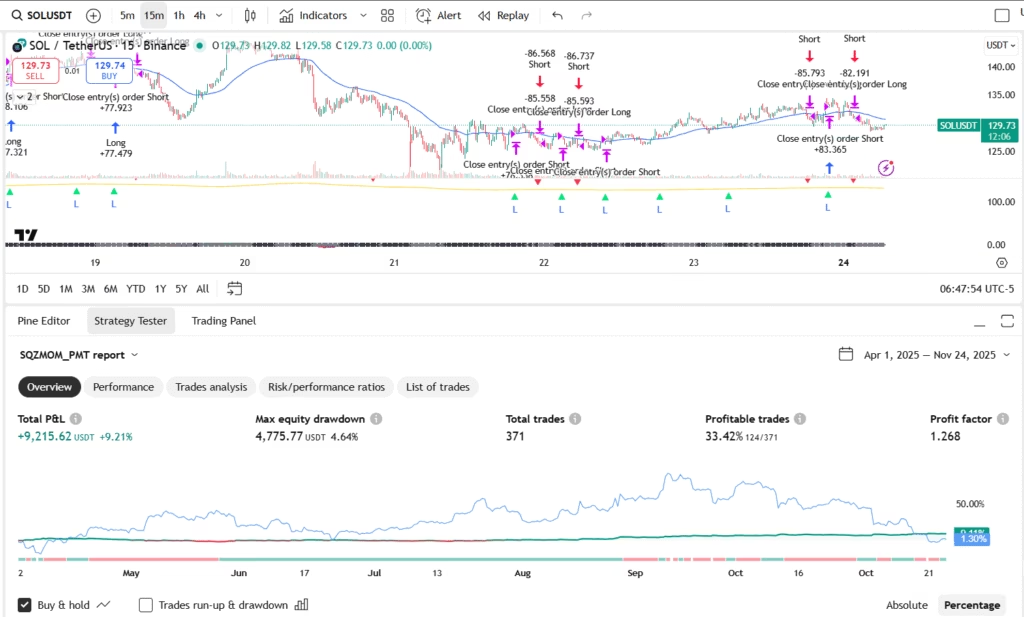
- Total P&L: +$9,215.62 (+9.21%)
- Max Drawdown: $4,775.77 (4.64%)
- Total Trades: 371
- Win Rate: 33.42%
- Profit Factor: 1.268
Forex – 15 Minute Timeframe
USD/JPY (15min)
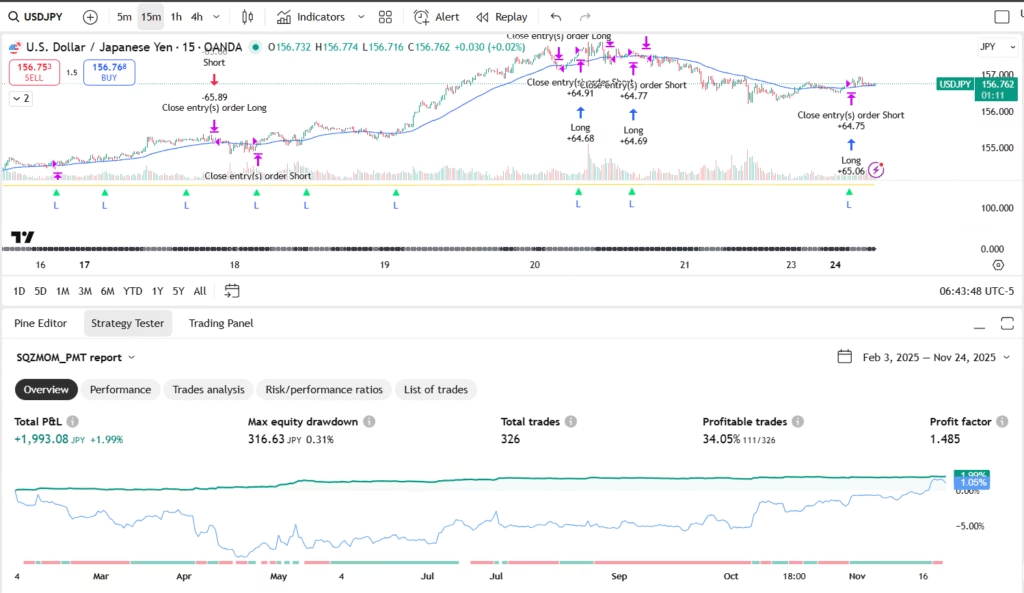
- Total P&L: +1,993.08 JPY (+1.99%)
- Max Drawdown: 316.63 JPY (0.31%)
- Total Trades: 326
- Win Rate: 34.05%
- Profit Factor: 1.485
Notable: Extremely low drawdown at just 0.31%, making it ideal for conservative traders
Stocks – 4 Hour Timeframe
TSLA (4h)
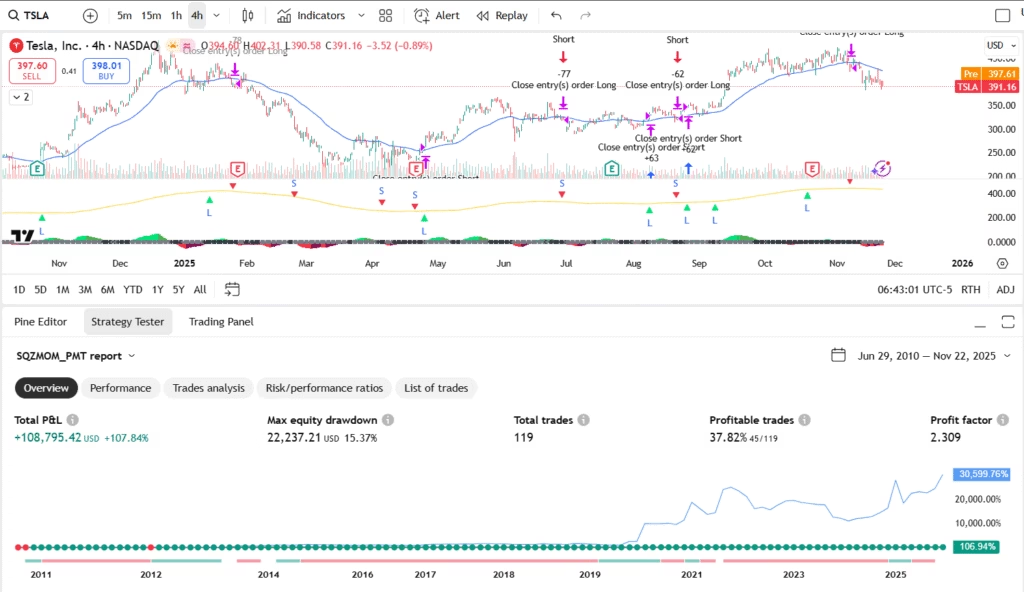
- Total P&L: +$108,795.42 (+107.84%)
- Max Drawdown: $22,237.21 (15.37%)
- Total Trades: 119
- Win Rate: 37.82%
- Profit Factor: 2.309
Outstanding performance with over 100% return and exceptional profit factor
NVDA (4h)
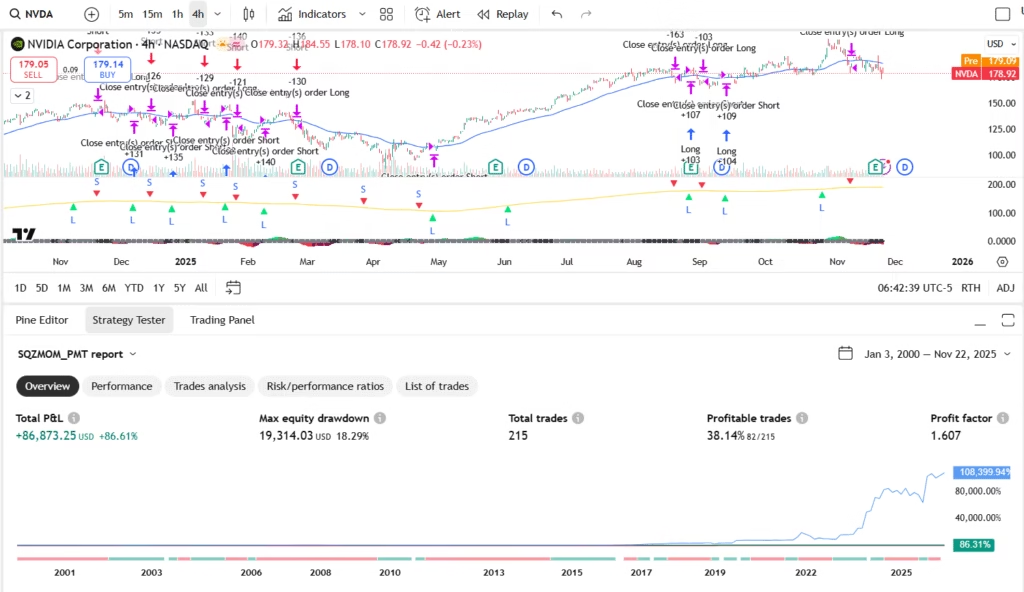
- Total P&L: +$86,873.25 (+86.61%)
- Max Drawdown: $19,314.03 (18.29%)
- Total Trades: 215
- Win Rate: 38.14%
- Profit Factor: 1.607
Cryptocurrency – 4 Hour Timeframe
ETH/USD (4h)
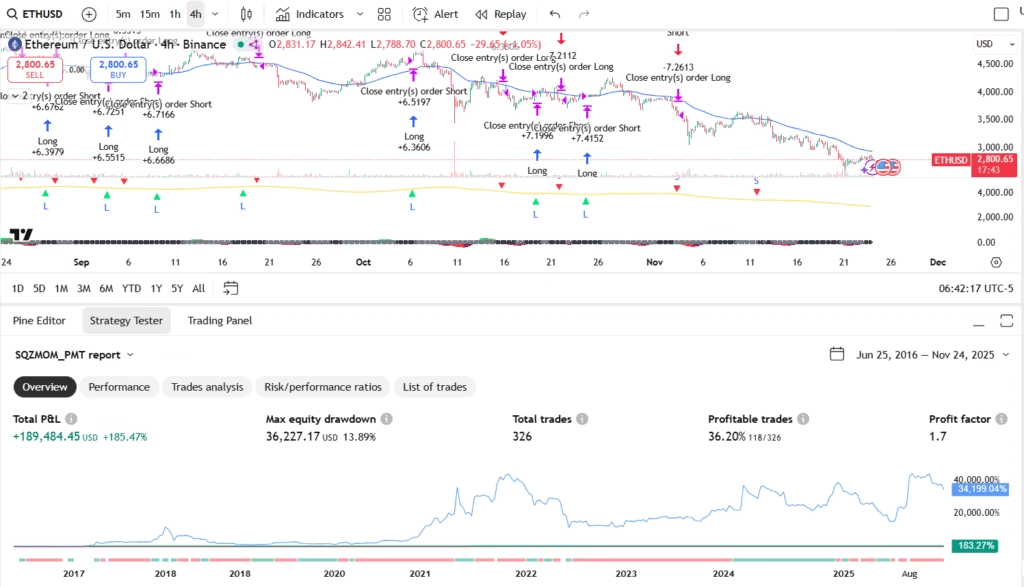
- Total P&L: +$189,484.45 (+185.47%)
- Max Drawdown: $36,227.17 (13.89%)
- Total Trades: 326
- Win Rate: 36.20%
- Profit Factor: 1.7
Impressive 185% return with controlled 13.89% drawdown
BTC/USD (4h)
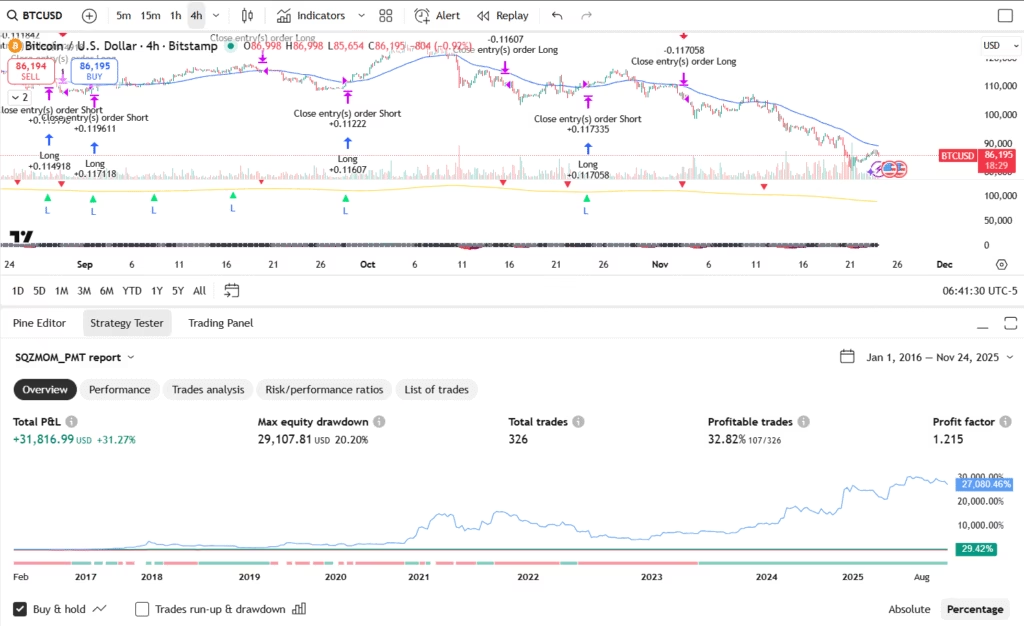
- Total P&L: +$31,816.99 (+31.27%)
- Max Drawdown: $29,107.81 (20.20%)
- Total Trades: 326
- Win Rate: 32.82%
- Profit Factor: 1.215
XRP/USD (4h)
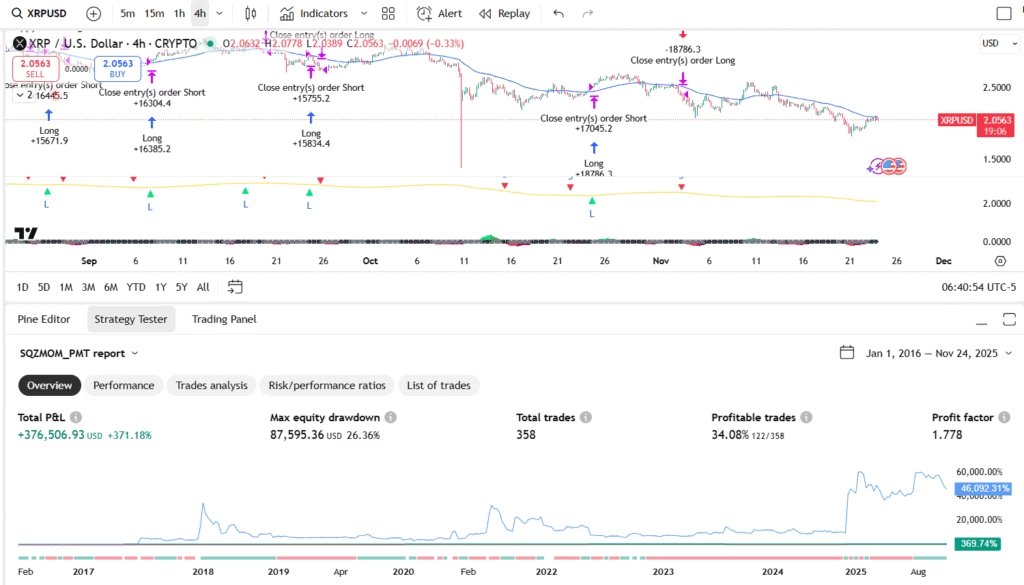
- Total P&L: +$376,506.93 (+371.18%)
- Max Drawdown: $87,595.36 (26.36%)
- Total Trades: 358
- Win Rate: 34.08%
- Profit Factor: 1.778
Exceptional 371% return over the backtest period
Key Takeaways from the Results
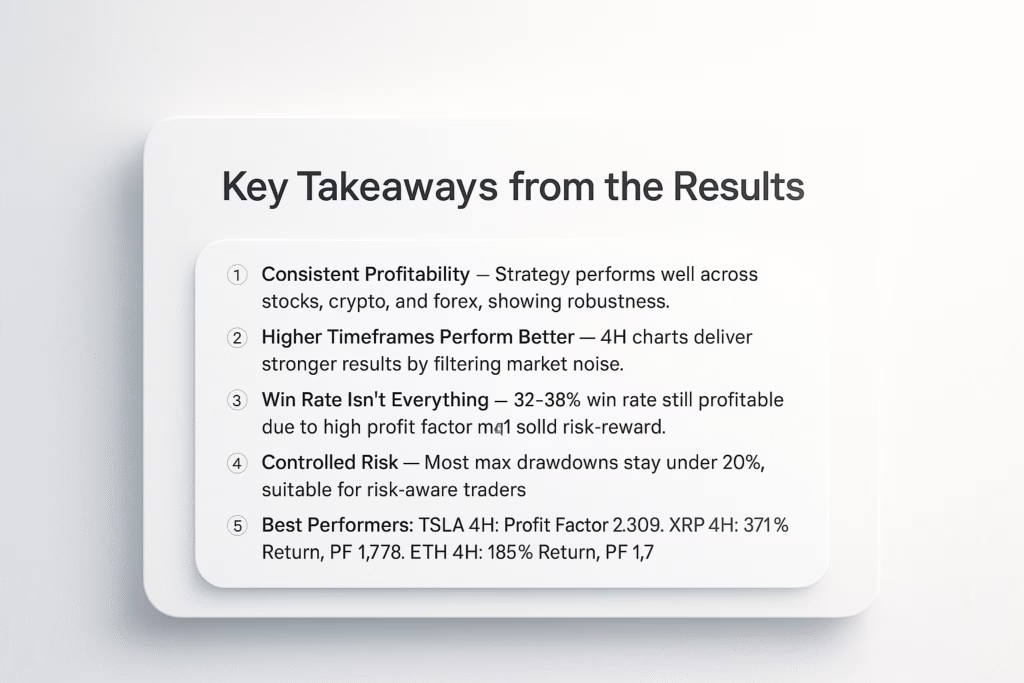
1. Consistent Profitability Across Markets
The strategy shows positive returns across stocks, crypto, and forex, demonstrating its versatility and robustness.
2. Higher Timeframes = Better Performance
Notice how the 4-hour timeframe generally produces better profit factors and returns compared to 15-minute charts. This is because higher timeframes filter out market noise and capture stronger trends.
3. Win Rate Doesn’t Tell the Whole Story
The strategy maintains profitability with win rates between 32-38%. This proves that with proper risk management and a high profit factor, you don’t need a 50%+ win rate to be consistently profitable.
4. Controlled Risk
Maximum drawdowns remain manageable across all instruments, with most staying under 20%, making this strategy suitable for risk-conscious traders.
5. Best Performers
- TSLA (4h): Profit Factor 2.309 – Making $2.30 for every $1 risked
- XRP (4h): 371% return with Profit Factor 1.778
- ETH (4h): 185% return with Profit Factor 1.7
How the Strategy Works
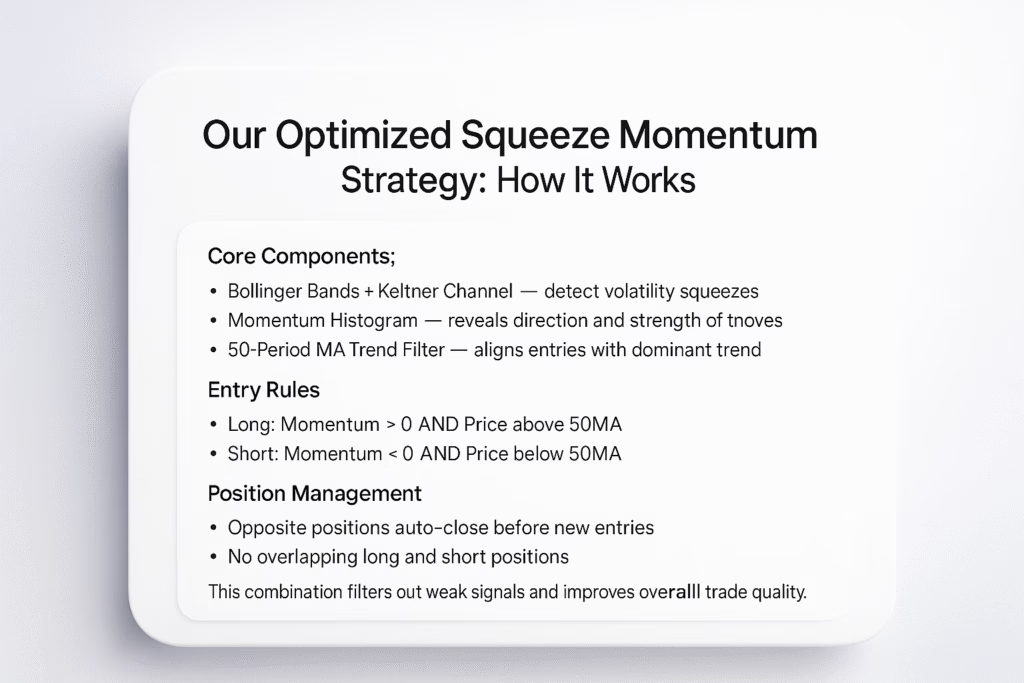
Our optimized strategy builds on LazyBear’s squeeze momentum logic and adds strategic entry filters:
Core Components:
- Bollinger Bands & Keltner Channel: Identifies squeeze conditions when volatility contracts (from original indicator)
- Momentum Histogram: Shows the direction and strength of momentum (from original indicator)
- 50-Period MA Trend Filter: Our optimization – ensures trades align with the dominant trend
Entry Rules:
- Long Entry: Momentum crosses above zero AND price is above 50 MA
- Short Entry: Momentum crosses below zero AND price is below 50 MA
Position Management:
- Automatically closes opposite positions before entering new trades
- No overlapping long and short positions
This combination filters out counter-trend signals that often resulted in losses when trading the indicator manually, focusing only on high-probability momentum moves aligned with the trend.
Indicator vs Strategy: Why This Matters
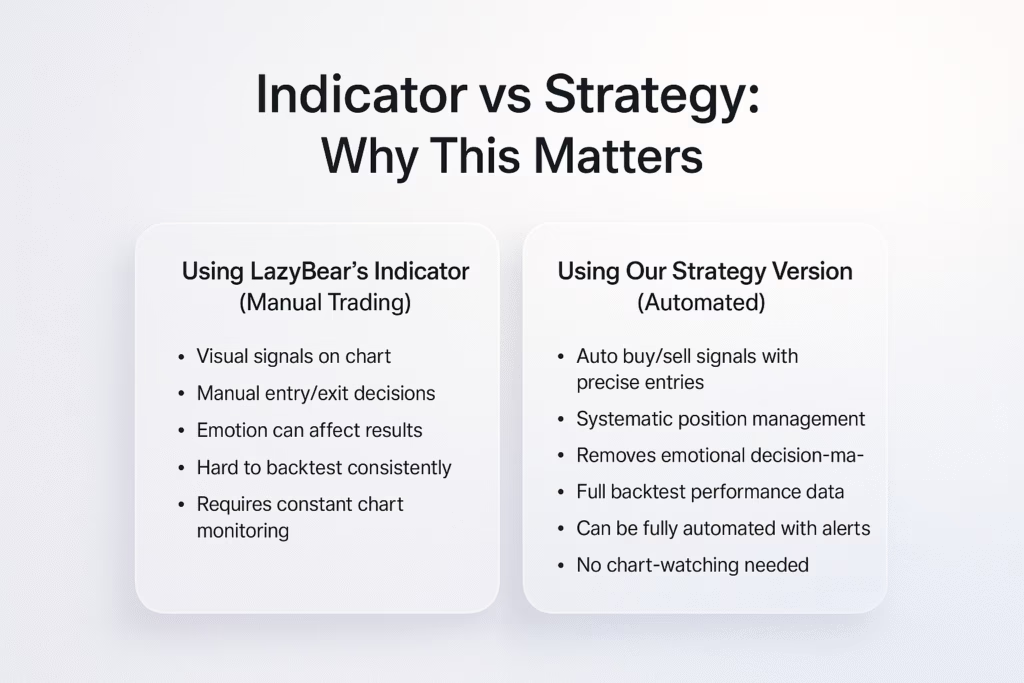
Using LazyBear’s Indicator (Manual Trading):
- You see the signals visually
- You decide when to enter/exit
- Emotional decisions can impact results
- Difficult to backtest systematically
- Requires constant chart monitoring
Using Our Strategy Version (Automated):
- Automatic buy/sell signals with precise entry points
- Systematic position management
- Remove emotional decision-making
- Complete backtest data to evaluate performance
- Can be fully automated with alerts
- No need to watch charts 24/7
Access the Strategy
Ready to use this strategy yourself?
Get the optimized strategy version
//@version=6
strategy("Squeeze Momentum Strategy [PickMyTrade]",
     shorttitle="SQZMOM_PMT",
     overlay=false,
     initial_capital=100000,
     default_qty_type=strategy.percent_of_equity,
     default_qty_value=10)

//-----------------------------------------------------------------------------
// Inputs
//-----------------------------------------------------------------------------
length        = input.int(20,  title="BB Length")
mult          = input.float(2.0, title="BB MultFactor")
lengthKC      = input.int(20,  title="KC Length")
multKC        = input.float(1.5, title="KC MultFactor")
useTrueRange  = input.bool(true, title="Use TrueRange (KC)")
maFilterLen   = input.int(50,  title="MA Filter Length (trend MA)")

//-----------------------------------------------------------------------------
// Squeeze Momentum core
//-----------------------------------------------------------------------------
source = close
basis  = ta.sma(source, length)
dev    = multKC * ta.stdev(source, length)
upperBB = basis + dev
lowerBB = basis - dev

ma      = ta.sma(source, lengthKC)
rangeKC = useTrueRange ? ta.tr(true) : (high - low)
rangema = ta.sma(rangeKC, lengthKC)
upperKC = ma + rangema * multKC
lowerKC = ma - rangema * multKC

sqzOn  = (lowerBB > lowerKC) and (upperBB < upperKC)
sqzOff = (lowerBB < lowerKC) and (upperBB > upperKC)
noSqz  = (sqzOn == false) and (sqzOff == false)

val = ta.linreg(
     source -
         math.avg(
             math.avg(ta.highest(high, lengthKC), ta.lowest(low, lengthKC)),
             ta.sma(close, lengthKC)
         ),
     lengthKC, 0)

// Colors
bcolor = val > 0 ?
              (val > nz(val[1]) ? color.lime : color.green) :
              (val < nz(val[1]) ? color.red  : color.maroon)

scolor = noSqz ? color.blue : sqzOn ? color.black : color.gray

plot(val, color=bcolor, style=plot.style_histogram, linewidth=4)
plot(0,  color=scolor, style=plot.style_cross,      linewidth=2)

//-----------------------------------------------------------------------------
// 50-MA trend filter
//-----------------------------------------------------------------------------
maFilter = ta.sma(close, maFilterLen)

// (Optional) show it in this pane just for reference
plot(maFilter, title="MA Filter (50)", color=color.yellow, linewidth=1)

//-----------------------------------------------------------------------------
// Strategy Logic
//-----------------------------------------------------------------------------
// Default conditions (Squeeze Momentum) + MA filter
longEntry  = ta.crossover(val, 0) and close > maFilter
shortEntry = ta.crossunder(val, 0) and close < maFilter

if (longEntry)
    if (strategy.position_size < 0)
        strategy.close("Short")
    strategy.entry("Long", strategy.long)

if (shortEntry)
    if (strategy.position_size > 0)
        strategy.close("Long")
    strategy.entry("Short", strategy.short)

// Entry markers
plotshape(longEntry,
     title="Long Entry",
     style=shape.triangleup,
     location=location.belowbar,
     size=size.tiny,
     color=color.lime, text="L")

plotshape(shortEntry,
     title="Short Entry",
     style=shape.triangledown,
     location=location.abovebar,
     size=size.tiny,
     color=color.red, text="S")
Original indicator by LazyBear: Squeeze Momentum Indicator [LazyBear]
Automate Your Trading with PickMyTrade
Backtesting is just the beginning. The real power comes from automation.
Automate Your TradingView Strategies
For Stock, Crypto, Futures, and Options: Visit pickmytrade.io to automate your trading across multiple brokers:
- Rithmic
- TradeStation
- TradeLocker
- Interactive Brokers
- ProjectX
For Tradovate Users: Visit pickmytrade.trade for seamless Tradovate broker integration
Transform your TradingView strategies into fully automated trading systems with real-time execution. No more manual order entry, no more missed signals.
Final Thoughts
We’ve taken one of TradingView’s most popular indicators and converted it into a fully automated, optimized trading strategy. The results speak for themselves – with profit factors ranging from 1.215 to 2.309 and consistent returns across multiple markets.
The addition of the 50-period MA trend filter has significantly improved the strategy’s performance by filtering out low-probability counter-trend trades that often plague momentum-based systems.
Credits:
- Original TTM Squeeze concept: John Carter (“Mastering the Trade”)
- Indicator implementation: LazyBear
- Strategy conversion and optimization: PickMyTrade Team
Remember:
- Backtest results are historical and don’t guarantee future performance
- Always practice proper risk management
- Test the strategy on a demo account before going live
- Consider using automation to eliminate emotional trading decisions
The combination of a robust strategy and automated execution gives you the best chance at consistent trading success.
Ready to take your trading to the next level?
Download the strategy from TradingView and explore automation options at PickMyTrade.
Disclaimer: Trading involves risk. Past performance does not guarantee future results. Always trade responsibly and never risk more than you can afford to lose.
You may also like:
Best TradingView Automation Tools 2025: PickMyTrade vs. TradersPost vs. NinjaTrader
TradingView vs. TrendSpider: Full Review
Best TradingView Indicators and Strategies: Free and Premium Tools for All Traders


It’s fascinating to see the performance data from this strategy. The integration of a trend filter for better risk-adjusted returns really caught my attention. Are there any particular market conditions where this strategy might struggle, or is it designed to perform well across all types of markets?