Seasonal trading patterns refer to recurring tendencies in financial markets tied to specific times of the year, driven by investor behavior, institutional activity, tax considerations, and economic cycles. These patterns, including holiday effects and quarter-end dynamics, offer traders opportunities to anticipate movements in stocks, futures, and other assets.
While not foolproof—especially as recent years like 2024 and 2025 showed deviations due to factors such as AI-driven rallies, geopolitical events, and policy shifts—these patterns remain valuable for informed decision-making. In US markets, they often manifest in equities and futures, where automation can help capitalize on them efficiently.
Key Seasonal Trading Patterns in the Stock Market
Historical data reveals consistent seasonal trading patterns:
- Sell in May and Go Away (Halloween Indicator): Markets historically underperform from May to October compared to November-April. Recent performance has been mixed; in 2025, summer months showed strength in sectors like resources and metals, challenging the adage, with some funds posting double-digit gains despite the “doldrums.”
- January Effect: Small-cap stocks tend to outperform in January due to tax-loss selling in December followed by reinvestment. In recent years (including 2024-2025), the effect has weakened or shifted, with broader market influences like rate cuts playing larger roles.
- September Effect: Often the weakest month historically, but exceptions occurred, such as positive returns in some recent Septembers.
These patterns stem from behavioral factors like vacation periods, bonus inflows, and portfolio rebalancing.
Holiday Effects in Seasonal Trading Patterns
Holidays significantly influence seasonal trading patterns, often leading to reduced liquidity and predictable biases.
The pre-holiday effect shows stocks rising before major breaks due to optimism and lower selling pressure. The Santa Claus Rally—the last five trading days of December plus the first two of January—has historically delivered positive returns about 75-80% of the time, averaging around 1.3-1.4%.
In late 2025, the rally showed promise with thin holiday liquidity but upward bias, supported by year-end flows and sentiment. Holiday periods also boost retail and consumer discretionary sectors from Thanksgiving shopping surges, while liquidity drops 45-70% around Christmas-New Year, widening spreads.
Recent analyses confirm these effects persist, though amplified by low volumes, creating both opportunities and risks for traders.
(Imagine a chart here showing S&P 500 performance around holidays, with Santa Claus Rally highlighted.)
Click Here To Automate Futures Trading
Quarter-End Effects and Window Dressing in Trading Patterns
Quarter-end effects arise from institutional “window dressing,” where fund managers adjust portfolios to showcase stronger holdings in reports. This leads to buying winners and selling losers near quarter-ends, boosting certain stocks temporarily.
In 2025, patterns included increased activity in AI-related and outperforming names like tech and commodities. Rebalancing flows and options expirations add volume spikes. Post-quarter reversals often occur as positions unwind.
These dynamics tie into broader seasonal trading patterns, with year-end effects overlapping holiday rallies for amplified Q4 strength.
Automating Trading Patterns with PickMyTrade
To capitalize on seasonal trading patterns like holiday rallies or quarter-end boosts in US markets, automation is key—especially in futures for 24/7 execution.
PickMyTrade stands out as a powerful platform for automating futures trading on US markets. It integrates seamlessly with brokers like Tradovate, Rithmic, Interactive Brokers, and TradeStation, enabling webhook-based automation from tools like TradingView.
Traders can set rules to trigger entries/exits around seasonal windows—e.g., positioning for Santa Claus Rally momentum in ES (S&P 500 futures) or NQ (Nasdaq futures), or capturing quarter-end volatility. Features include precise execution, risk management, and cloud-based operation, ideal for exploiting low-liquidity holiday periods or window-dressing flows without constant monitoring.
With over thousands of users automating strategies, PickMyTrade helps turn seasonal trading patterns into consistent edges in futures markets.
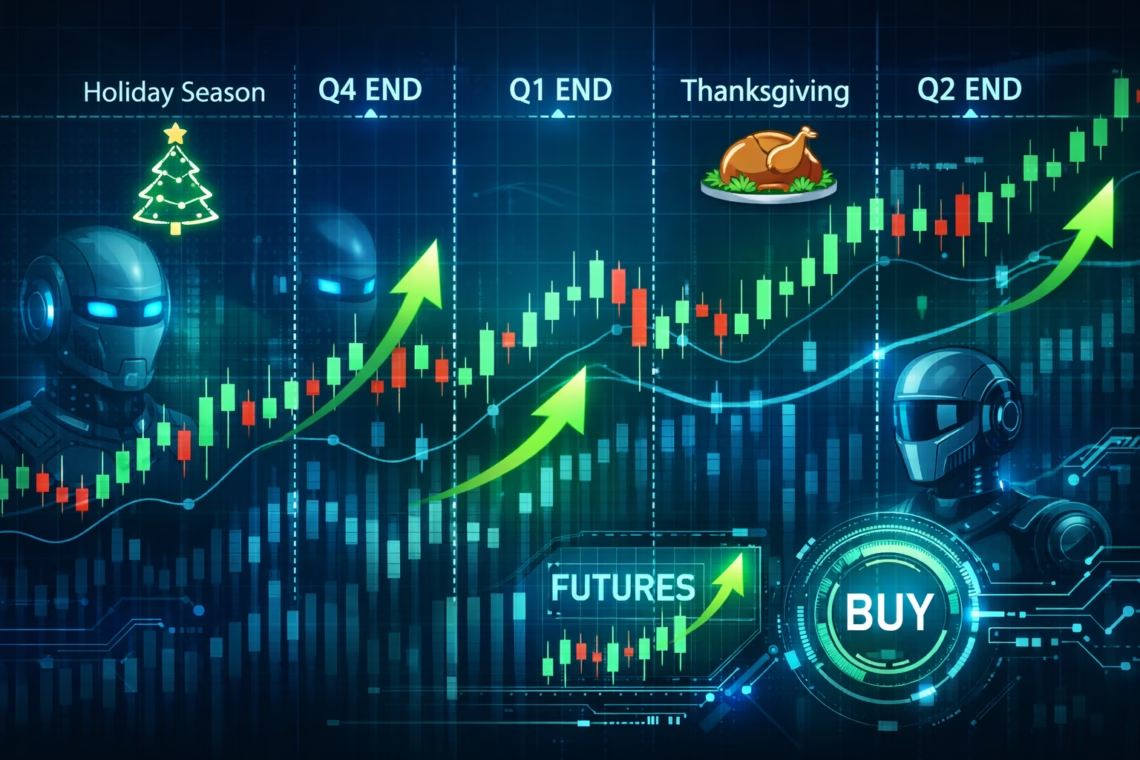
(Visual of automated futures trading dashboard with seasonal calendar alerts.)
Conclusion: Leveraging Trading Patterns Today
Seasonal trading patterns—from holiday effects to quarter-end dynamics—provide probabilistic edges in US markets. While anomalies evolve (as seen in 2025 deviations), combining historical insights with modern tools like automation enhances outcomes. Always pair with risk management, diversification, and current analysis, as past patterns don’t guarantee future results.
Most Asked FAQs
What are seasonal trading patterns?
Recurring market tendencies based on calendar events, like stronger Q4 performance or weaker summers.
Does the Santa Claus Rally still work in recent years?
It remains reliable historically (positive ~75-80% of the time), with supportive signs in late 2025 despite thin liquidity.
Is Sell in May and Go Away effective?
Mixed results recently; 2025 summers showed strength in certain sectors, reducing reliability.
What causes quarter-end window dressing?
Fund managers adjust portfolios for better reporting, creating temporary buying pressure.
Disclaimer:
This content is for informational purposes only and does not constitute financial, investment, or trading advice. Trading and investing in financial markets involve risk, and it is possible to lose some or all of your capital. Always perform your own research and consult with a licensed financial advisor before making any trading decisions. The mention of any proprietary trading firms, brokers, does not constitute an endorsement or partnership. Ensure you understand all terms, conditions, and compliance requirements of the firms and platforms you use.
Also Checkout: Automate TradingView Indicators with Tradovate Using PickMyTrade