In the fast-evolving world of algorithmic trading, raw profits alone don’t tell the full story. Performance Metrics provide the objective lens to assess strategy quality, risk management, and long-term viability. As markets in 2026 incorporate more AI-driven adaptations, volatility from global events, and high-frequency execution, understanding these Performance Metrics is essential for traders—whether manual or fully automated.
Recent analyses from 2025-2026 highlight that top-performing algos prioritize risk-adjusted returns over sheer gains. Tools like automated platforms enable seamless execution and real-time monitoring of these metrics, helping traders refine strategies on US futures markets.
Why Performance Metrics Matter in Algorithmic Trading
Performance Metrics go beyond net profit to reveal how a strategy handles risk, consistency, and market regimes. Poor metrics can signal overfitting, excessive drawdowns, or unsustainable edges.
In 2025-2026, sources emphasize combining return, risk, and execution metrics. For instance, high Sharpe Ratios (above 1.5-2.0 in elite cases) and low drawdowns remain benchmarks, while Profit Factor above 2.0 indicates strong profitability relative to losses.
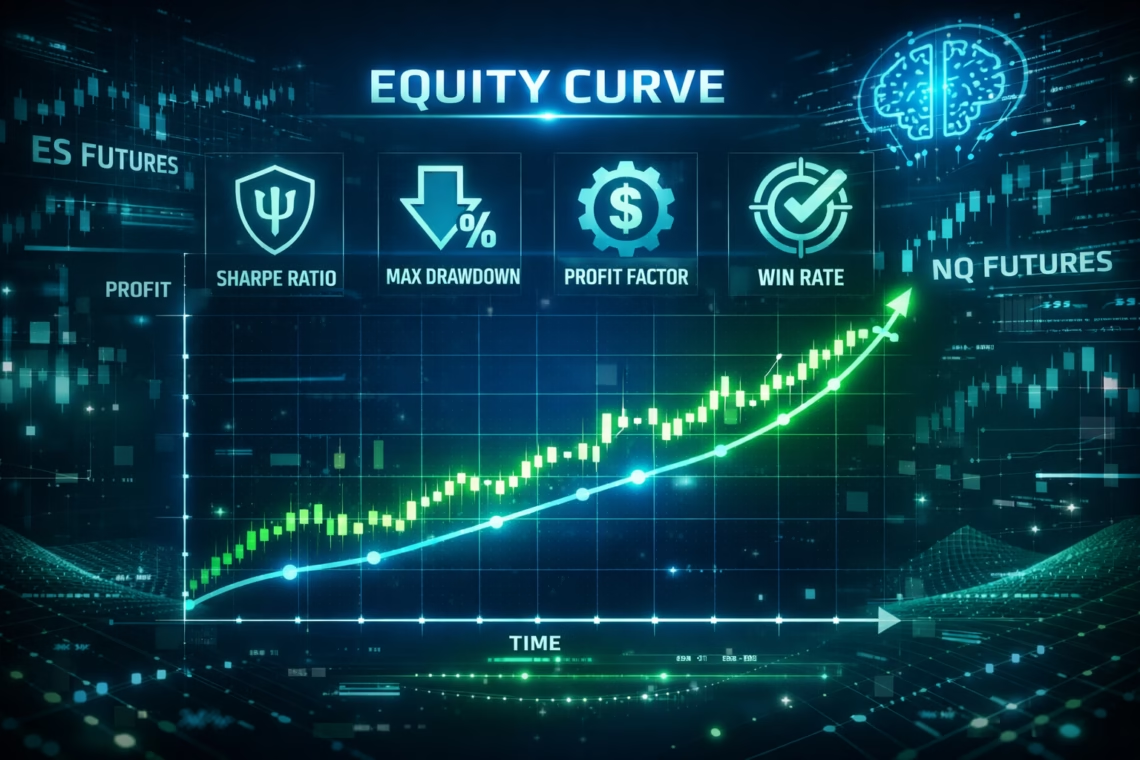
Key Performance Metrics for Algo Strategy Evaluation
Here are the most critical Performance Metrics used by quants and retail traders in 2026:
Sharpe Ratio: The Gold Standard for Risk-Adjusted Performance Metrics
The Sharpe Ratio measures excess return per unit of risk (standard deviation), adjusted for a risk-free rate.
Formula: Sharpe Ratio = (Strategy Return – Risk-Free Rate) / Standard Deviation of Returns
A Sharpe above 1.0 is solid; 2.0+ is exceptional in futures trading. Recent 2025-2026 reviews show adaptive AI strategies achieving 1.5-2.26 in volatile conditions. It helps compare strategies apples-to-apples.
Maximum Drawdown: Critical Risk Performance Metric
Maximum Drawdown (MDD) tracks the largest peak-to-trough decline in equity. Lower MDD (under 10-20% for conservative futures algos) signals better capital preservation.
In 2025 reports, elite systems kept MDD below 8-18%, even in high-volatility periods. High drawdowns often lead to psychological and margin issues.
Profit Factor: Core Profitability Performance Metric
Profit Factor = Gross Profits / Gross Losses
A value >1.5-2.0 is strong; >3.0-4.0 indicates exceptional edge (seen in top AI agents in 2025). It directly shows if wins outweigh losses meaningfully.
Win Rate and Expectancy: Trade Success Performance Metrics
Win Rate (% of profitable trades) often ranges 45-70% in robust systems—higher isn’t always better if risk-reward favors winners.
Expectancy = (Win Rate × Average Win) – (Loss Rate × Average Loss)
Positive expectancy ensures long-term profitability.
Click Here to Automate Futures Trading
Other Essential Performance Metrics
- Sortino Ratio — Focuses on downside volatility (preferred for asymmetric strategies).
- Calmar Ratio — Annualized Return / MDD (higher = better resilience).
- Annualized Return & CAGR — For growth assessment (10-30% realistic in automated futures).
- Volatility & Beta — Measure stability vs. market.
In futures, execution metrics like slippage and fill rates gain importance due to leverage.
Applying Performance Metrics in Futures Trading Automation
For US markets (e.g., E-mini S&P 500, Nasdaq-100 futures), automation simplifies tracking Performance Metrics. Platforms like PickMyTrade excel here—automating TradingView strategies directly to brokers like Tradovate or Rithmic for 24/7 execution.
PickMyTrade supports unlimited alerts, tickers, and sessions, ideal for futures automation. Traders set risk rules (e.g., fixed stops), monitor real-time metrics like win rate and drawdown, and scale across accounts. Recent user cases show seamless SuperTrend or trend-following automation yielding consistent results with low latency.
By integrating PickMyTrade, you can backtest, deploy, and evaluate Performance Metrics without coding—focusing on optimization rather than manual execution.
Best Practices for Using Performance Metrics in 2026
- Backtest rigorously across regimes (bull, bear, sideways).
- Monitor live metrics weekly; adjust for regime shifts.
- Avoid overfitting—use out-of-sample testing.
- Combine metrics: High Sharpe with low MDD often beats high returns alone.
- Leverage automation tools like PickMyTrade for futures to maintain discipline.
Mastering Performance Metrics separates consistent winners from the rest in algorithmic trading.
FAQs
What is the most important Performance Metric for algo trading?
The Sharpe Ratio is widely regarded as key for risk-adjusted evaluation, but combine it with Maximum Drawdown and Profit Factor for a complete view.
How do I calculate Sharpe Ratio for my algo strategy?
Subtract the risk-free rate from your strategy’s return, then divide by the standard deviation of returns. Annualize for comparison.
What is a good Profit Factor in futures algo trading?
Above 1.5 is acceptable; 2.0+ is strong, and 3.0+ exceptional, based on 2025-2026 performance reviews.
Why is Maximum Drawdown crucial in Performance Metrics?
It shows worst-case capital loss, helping assess risk tolerance and avoid blowups in leveraged futures trading.
Disclaimer:
This content is for informational purposes only and does not constitute financial, investment, or trading advice. Trading and investing in financial markets involve risk, and it is possible to lose some or all of your capital. Always perform your own research and consult with a licensed financial advisor before making any trading decisions. The mention of any proprietary trading firms, brokers, does not constitute an endorsement or partnership. Ensure you understand all terms, conditions, and compliance requirements of the firms and platforms you use.
Also Checkout: Automate TradingView Indicators with Tradovate Using PickMyTrade