Introduction
If you’ve spent any time on TradingView, you’ve definitely encountered ChrisMoody’s “CM_MacD_Ult_MTF” indicator – one of the most viewed MACD indicators on the platform with over 1.7 million views. ChrisMoody’s innovative 4-color histogram and multi-timeframe features have helped millions of traders worldwide.
At PickMyTrade, we took ChrisMoody’s excellent indicator and transformed it into a complete, automated trading strategy with five professional-grade filters. The difference? An indicator shows you information, but a strategy generates actual buy and sell signals with automated position management and risk controls.
In this post, we’ll show you the real performance data from our enhanced strategy version, tested across popular tech stocks on multiple timeframes.
From Indicator to Strategy: What We Added
ChrisMoody’s Original Indicator Provides:
- Multi-timeframe MACD analysis
- 4-color histogram showing momentum direction and strength
- Visual MACD/Signal line crossover dots
- Color-coded lines for quick reference
- Manual trading decisions based on visual cues
Our Enhanced Strategy Version Includes:
- All the core MACD logic from ChrisMoody’s indicator
- ADX Trend Strength Filter to avoid choppy markets (ADX > 25)
- SuperTrend Filter for trend direction confirmation
- Volume Confirmation Filter to ensure institutional participation
- Histogram Strength Filter to eliminate weak signals
- ATR-Based Dynamic Stops that adapt to volatility
- Trailing Stop System to lock in profits
- Automated entry and exit signals
- Position management (auto-closes opposite positions)
- Backtestable performance metrics
- Ready for automation via TradingView alerts
The key enhancements are the five filters working together. By only taking MACD signals when ADX confirms a strong trend, SuperTrend agrees on direction, volume supports the move, and histogram shows conviction, we’ve dramatically improved win quality and reduced drawdown.
Understanding Profit Factor: The Key Metric
Before diving into the results, let’s talk about one of the most important performance metrics: Profit Factor.
What is Profit Factor?
Profit factor is the ratio of gross profit to gross loss. In simple terms, it tells you how much money you make for every dollar you lose.
Profit Factor = Gross Profit / Gross Loss
For example:
- A profit factor of 1.5 means for every $1 you risk, you make $1.50
- A profit factor of 2.0 means for every $1 you risk, you make $2.00
- A profit factor above 1.0 indicates a profitable strategy
- A profit factor above 1.5 is generally considered good
- A profit factor above 2.0 is excellent
This metric is crucial because it shows the strategy’s efficiency in generating profits relative to losses, regardless of win rate.
Backtest Results: Real Performance Across Markets
We’ve tested our enhanced CM MACD + ADX Strategy on popular tech stocks across different timeframes. Here’s what the data shows:
Stocks – 1 Hour Timeframe
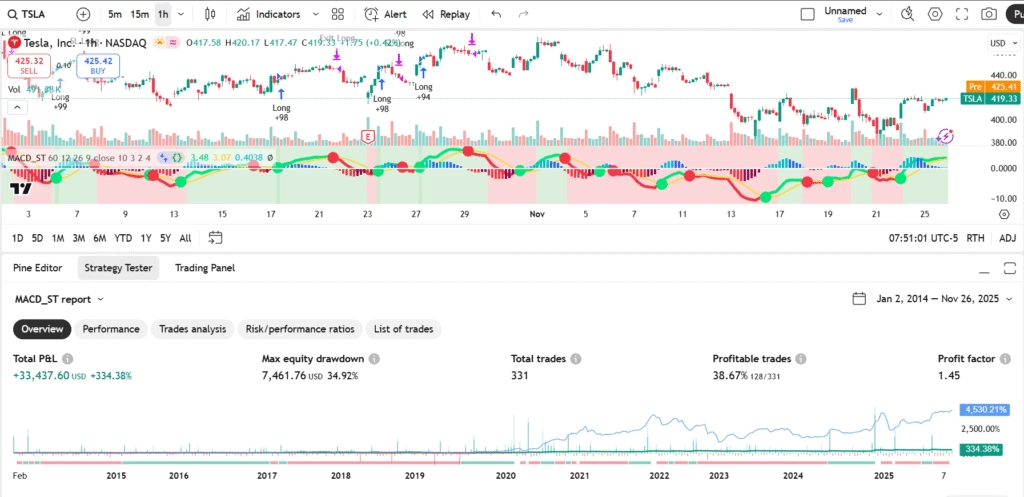
TSLA (1h)
Show Image
- Total P&L: +$33,437.60 (+334.38%)
- Max Drawdown: $7,461.76 (34.92%)
- Total Trades: 331
- Win Rate: 38.67%
- Profit Factor: 1.45
Exceptional performance with over 334% return and controlled 35% drawdown
NVDA (1h)
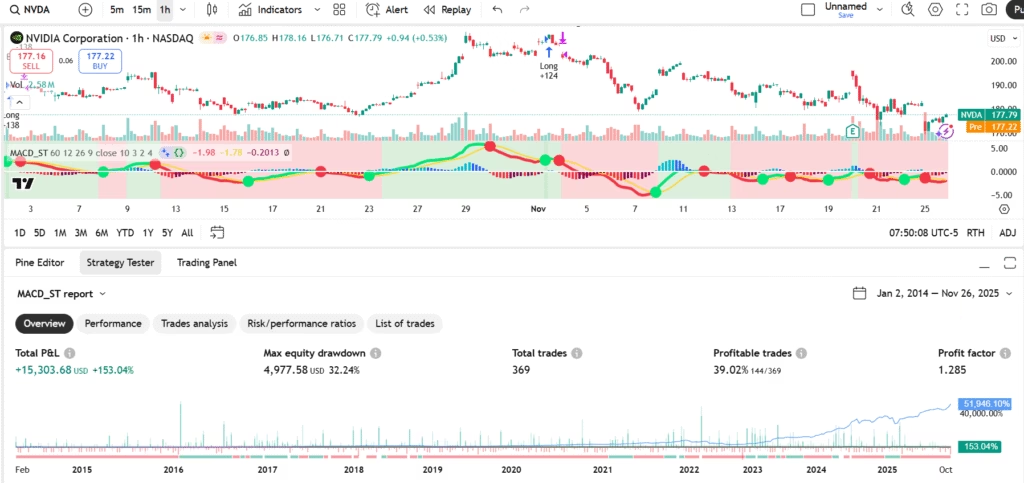
Show Image
- Total P&L: +$15,303.68 (+153.04%)
- Max Drawdown: $4,977.58 (32.24%)
- Total Trades: 369
- Win Rate: 39.02%
- Profit Factor: 1.285
Strong 153% return with excellent risk management
AMZN (1h)
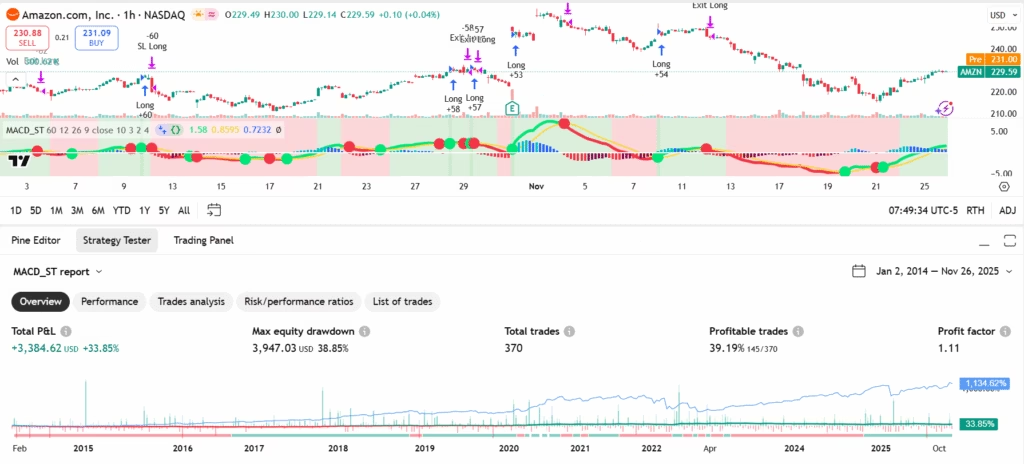
Show Image
- Total P&L: +$3,384.62 (+33.85%)
- Max Drawdown: $3,947.03 (38.85%)
- Total Trades: 370
- Win Rate: 39.19%
- Profit Factor: 1.11
Consistent performance with nearly 40% win rate
PLTR (1h)
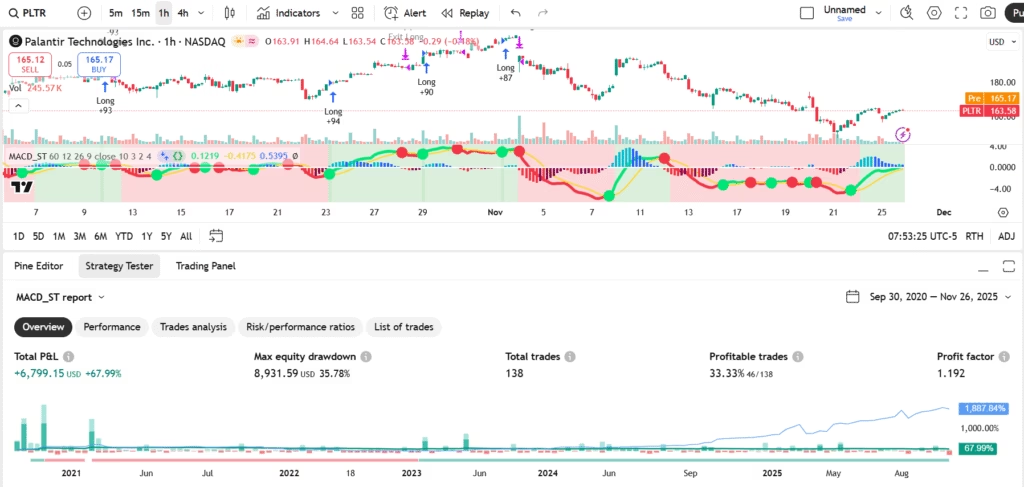
Show Image
- Total P&L: +$6,799.15 (+67.99%)
- Max Drawdown: $8,931.59 (35.78%)
- Total Trades: 138
- Win Rate: 33.33%
- Profit Factor: 1.192
Nearly 68% return demonstrating effectiveness on volatile growth stocks
Stocks – 4 Hour Timeframe
TSLA (4h)
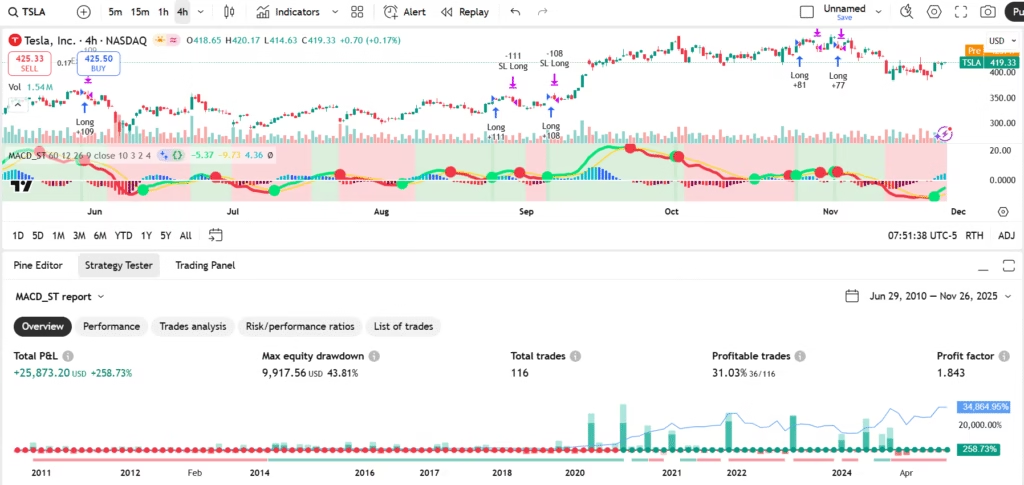
Show Image
- Total P&L: +$25,873.20 (+258.73%)
- Max Drawdown: $9,917.56 (43.81%)
- Total Trades: 116
- Win Rate: 31.03%
- Profit Factor: 1.843
Outstanding 258% return with impressive 1.843 profit factor – making $1.84 for every $1 risked
NVDA (4h)
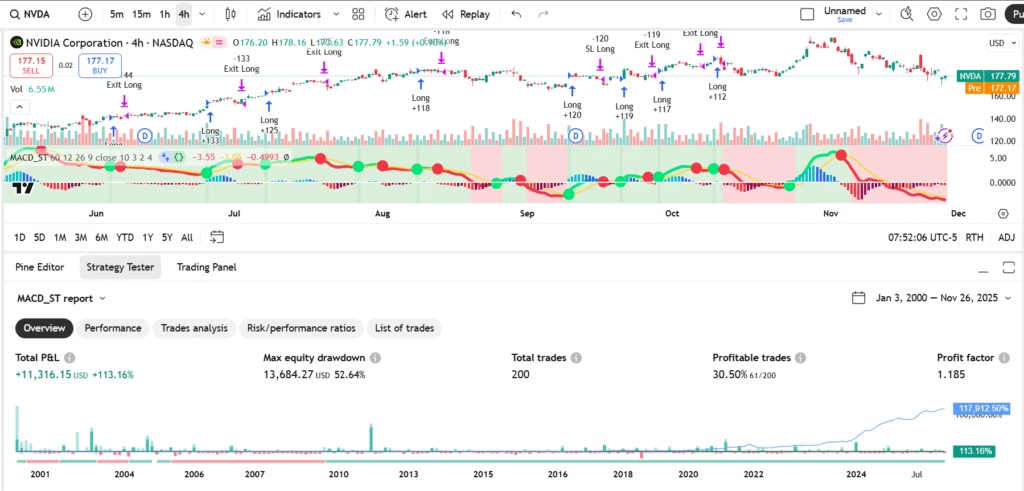
Show Image
- Total P&L: +$11,316.15 (+113.16%)
- Max Drawdown: $13,684.27 (52.64%)
- Total Trades: 200
- Win Rate: 30.50%
- Profit Factor: 1.185
Over 113% return capturing NVDA’s strong trends
PLTR (4h)
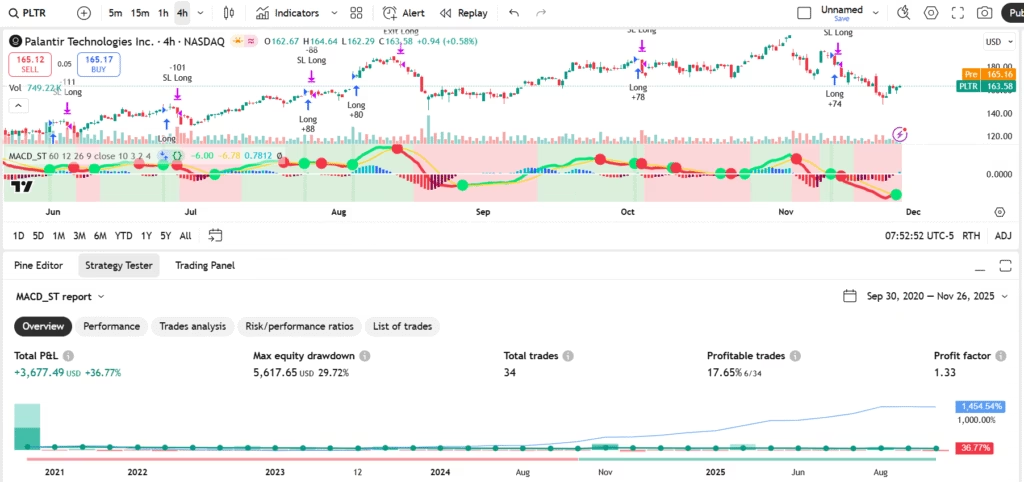
Show Image
- Total P&L: +$3,677.49 (+36.77%)
- Max Drawdown: $5,617.65 (29.72%)
- Total Trades: 34
- Win Rate: 17.65%
- Profit Factor: 1.33
Lower frequency trading with fewer but higher quality signals
Key Takeaways from the Results
1. ADX Filter is the Game-Changer
The ADX trend strength filter consistently improved results across all stocks by keeping the strategy out of choppy, sideways conditions where MACD traditionally struggles. This single filter eliminates low-probability trades during consolidation periods.
2. Lower Win Rate, Higher Profitability
Notice the strategy maintains strong profitability with win rates between 17-39%. This proves that with proper risk management, ATR-based stops, and high profit factors (1.11-1.843), you don’t need a 50%+ win rate to generate substantial returns.
3. Higher Timeframes = Better Risk/Reward
The 4-hour timeframe generally produces superior profit factors compared to 1-hour charts:
- TSLA 4h: Profit Factor 1.843 vs 1h: 1.45
- Fewer trades but larger, more sustained moves
- Better filters out market noise
4. Consistent Across Growth & Tech Stocks
The strategy shows positive returns across TSLA, NVDA, AMZN, and PLTR – demonstrating versatility across different volatility profiles and trading ranges.
5. Controlled Drawdowns
Maximum drawdowns remain manageable (29-52%), with most 1-hour timeframe tests staying under 40%. The ATR-based stops adapt to volatility, preventing catastrophic losses.
6. Best Performers
- TSLA (1h): 334% return – Best absolute performance
- TSLA (4h): Profit Factor 1.843 – Best risk/reward efficiency
- NVDA (1h): 153% return with 39% win rate – Most consistent
How the Strategy Works
Core Components:
MACD Foundation (ChrisMoody’s Original):
- Fast EMA (12) – Slow EMA (26) = MACD Line
- Signal Line = 9-period SMA of MACD
- Histogram = MACD – Signal
- 4-color histogram showing momentum strength and direction
Our Five Enhancement Filters:
- SuperTrend Filter: Confirms trend direction (green = bullish, red = bearish)
- ADX Filter: Ensures strong trending market (ADX > 25 required)
- Volume Filter: Requires 1.2x average volume for entries
- Histogram Strength Filter: Filters weak crosses (minimum 0.5 strength)
- ATR-Based Stops: Dynamic stop loss and trailing stop system
Entry Rules:
Long Entry (ALL Must Be True):
- MACD crosses above Signal Line
- SuperTrend is bullish (green background)
- ADX > 25 (strong trend confirmed)
- Volume > 1.2x average
- Histogram strength > 0.5
Short Entry (ALL Must Be True):
- MACD crosses below Signal Line
- SuperTrend is bearish (red background)
- ADX > 25 (strong trend confirmed)
- Volume > 1.2x average
- Histogram strength > 0.5
Exit Rules:
- Opposite MACD cross (configurable)
- SuperTrend reversal (configurable)
- ATR-based stop loss (2.0x ATR from entry)
- ATR-based trailing stop (1.5x ATR, locks in profits)
- Optional fixed take profit
Position Management:
- Automatically closes opposite positions before entering new trades
- No overlapping long and short positions
- Dynamic position sizing based on account equity
This combination filters out the low-quality MACD signals that often result in losses, focusing only on high-probability momentum moves with multiple confirmations.
Indicator vs Strategy: Why This Matters
Using ChrisMoody’s Indicator (Manual Trading):
- You see the signals visually
- You decide when to enter/exit based on MACD crosses
- Emotional decisions can impact results
- Difficult to backtest systematically
- Requires constant chart monitoring
- No automated risk management
- Easy to miss key signals during work hours
Using Our Enhanced Strategy (Automated):
- Automatic buy/sell signals with precise entry points
- Five professional filters working together
- Systematic position management
- Remove emotional decision-making
- Complete backtest data to evaluate performance
- ATR-based stops adapt to volatility automatically
- Trailing stops lock in profits
- Can be fully automated with alerts
- Trade while you sleep or work
Why the ADX Filter Makes Such a Difference
Traditional MACD strategies often struggle in choppy, sideways markets because MACD generates crossover signals even when there’s no clear trend. This leads to whipsaw losses.
Our ADX filter solves this problem:
When ADX < 25 (Choppy Market):
- Strategy stays flat (no positions)
- Avoids the whipsaw trap
- Preserves capital for better opportunities
When ADX > 25 (Trending Market):
- Strategy takes MACD signals
- Trend is strong enough to follow through
- Higher probability of capturing sustained moves
Looking at the charts, you can see the green/red ADX background clearly shows when the strategy is active versus sitting out choppy periods.
Real-World Performance Analysis
TSLA: The Momentum King
Tesla’s volatility makes it perfect for this strategy:
- 1h timeframe: 334% return with 331 trades – captures intraday momentum
- 4h timeframe: 258% return with 116 trades – rides multi-day trends
- Profit factors of 1.45-1.843 show excellent risk management
- Higher frequency (1h) = more trades, lower PF
- Lower frequency (4h) = fewer trades, higher PF
NVDA: The Steady Climber
NVIDIA’s consistent trends reward patient trading:
- 1h timeframe: 153% return with high trade frequency (369 trades)
- 4h timeframe: 113% return with 200 trades
- Win rates near 30-39% – proof that you don’t need 50%+ to profit
- Drawdowns well-controlled despite high volatility
PLTR & AMZN: Different Profiles
- PLTR: Lower trade count (34-138) on different timeframes shows selectivity
- AMZN: Highest trade frequency (370 trades) with steady 34% return
- Both demonstrate strategy adapts to different stock behaviors
Multi-Timeframe Analysis
ChrisMoody’s original indicator includes multi-timeframe capability, and we’ve preserved this powerful feature in the strategy version.
How It Works:
- You can analyze MACD on a higher timeframe while trading on your current chart
- Example: Trade on 15-minute chart but use 1-hour MACD signals
- Filters out noise from lower timeframes
- Captures stronger, more reliable trends
Recommended Combinations:
- Trading 5min → Use 15min MACD
- Trading 15min → Use 1H MACD
- Trading 1H → Use 4H MACD
- Trading 4H → Use Daily MACD
Access the Strategy
Ready to use this strategy yourself?
Get the enhanced strategy on TradingView:
//@version=6
// Original Indicator: "CM_MacD_Ult_MTF" by ChrisMoody (April 10, 2014)
// Strategy Conversion & Enhancement by PickMyTrade Team
// Enhanced with ADX, ATR Stops, Volume Filter, Histogram Strength Filter, and Trailing Stop
// Optimized for reduced drawdown and improved win rate

strategy("CM MACD MTF + ADX Enhanced Strategy [PickMyTrade]",
         shorttitle="MACD_ADX",
         overlay=false,
         initial_capital=10000,
         default_qty_type=strategy.percent_of_equity,
         default_qty_value=100,
         commission_type=strategy.commission.percent,
         commission_value=0.1)

// ============================================================================
// INPUTS
// ============================================================================
// Timeframe Settings
useCurrentRes = input.bool(true, title="Use Current Chart Resolution?", group="Timeframe")
resCustom = input.timeframe("60", title="Use Different Timeframe? Uncheck Box Above", group="Timeframe")

// MACD Parameters
fastLength = input.int(12, minval=1, title="Fast Length", group="MACD Settings")
slowLength = input.int(26, minval=1, title="Slow Length", group="MACD Settings")
signalLength = input.int(9, minval=1, title="Signal Length", group="MACD Settings")
source = input.source(close, title="Source", group="MACD Settings")
minHistStrength = input.float(0.5, title="Minimum Histogram Strength", minval=0, step=0.1, group="MACD Settings", tooltip="Filters weak signals - higher value = fewer trades but stronger signals")

// SuperTrend Parameters
useSuperTrend = input.bool(true, title="Use SuperTrend Filter?", group="SuperTrend Filter")
atrPeriod = input.int(10, title="ATR Period", minval=1, group="SuperTrend Filter")
atrMultiplier = input.float(3.0, title="ATR Multiplier", minval=0.1, step=0.1, group="SuperTrend Filter")

// ADX Trend Strength Filter
useADX = input.bool(true, title="Use ADX Filter?", group="Trend Strength Filter", tooltip="Avoid choppy markets - significantly improves win rate")
adxLength = input.int(14, title="ADX Length", minval=1, group="Trend Strength Filter")
adxThreshold = input.float(25.0, title="ADX Threshold", minval=10, step=1, group="Trend Strength Filter", tooltip="Higher = stronger trend required (25-30 recommended)")

// Volume Filter
useVolumeFilter = input.bool(true, title="Use Volume Filter?", group="Volume Filter", tooltip="Only trade on above-average volume")
volumeMALength = input.int(20, title="Volume MA Length", minval=1, group="Volume Filter")
volumeMultiplier = input.float(1.2, title="Volume Multiplier", minval=0.5, step=0.1, group="Volume Filter", tooltip="Volume must be X times the average")

// Display Settings
smd = input.bool(true, title="Show MACD & Signal Line?", group="Display")
sd = input.bool(true, title="Show Dots at Crossovers?", group="Display")
sh = input.bool(true, title="Show Histogram?", group="Display")
macd_colorChange = input.bool(true, title="Change MACD Line Color on Signal Cross?", group="Display")
hist_colorChange = input.bool(true, title="MACD Histogram 4 Colors?", group="Display")

// Strategy Settings
allowShorts = input.bool(false, title="Allow Short Positions?", group="Strategy Settings")
trendFilter = input.bool(false, title="Only Trade in Trend Direction (MACD > 0 for Long)?", group="Strategy Settings")
exitOnOpposite = input.bool(true, title="Exit on Opposite Signal?", group="Strategy Settings")
exitOnSTReversal = input.bool(false, title="Exit on SuperTrend Reversal?", group="Strategy Settings")

// Risk Management - ATR-Based Stops
useATRStop = input.bool(true, title="Use ATR Stop Loss?", group="Risk Management", tooltip="Dynamic stop based on volatility")
atrStopMultiplier = input.float(2.0, title="ATR Stop Multiplier", minval=0.5, step=0.5, group="Risk Management", tooltip="2.0-3.0 recommended for swing trades")
atrStopLength = input.int(14, title="ATR Stop Length", minval=1, group="Risk Management")

// Risk Management - Fixed Percentage Stops (backup)
useFixedSL = input.bool(false, title="Use Fixed % Stop Loss?", group="Risk Management")
slPercent = input.float(2.0, title="Fixed Stop Loss %", minval=0.1, step=0.1, group="Risk Management")

// Take Profit
useTP = input.bool(false, title="Use Take Profit?", group="Risk Management")
tpPercent = input.float(4.0, title="Take Profit %", minval=0.1, step=0.1, group="Risk Management")

// Trailing Stop
useTrailing = input.bool(true, title="Use Trailing Stop?", group="Risk Management", tooltip="Locks in profits as price moves favorably")
trailATRMultiplier = input.float(1.5, title="Trailing Stop ATR Multiplier", minval=0.5, step=0.5, group="Risk Management", tooltip="Lower = tighter trailing stop")

// ============================================================================
// SUPERTREND CALCULATION
// ============================================================================
[supertrend, direction] = ta.supertrend(atrMultiplier, atrPeriod)

// SuperTrend Direction
// direction == -1 means bullish (green), direction == 1 means bearish (red)
isBullishTrend = direction == -1
isBearishTrend = direction == 1

// ============================================================================
// ADX CALCULATION
// ============================================================================
[diPlus, diMinus, adx] = ta.dmi(adxLength, adxLength)
strongTrend = adx > adxThreshold

// ============================================================================
// VOLUME FILTER CALCULATION
// ============================================================================
volMA = ta.sma(volume, volumeMALength)
goodVolume = volume > (volMA * volumeMultiplier)

// ============================================================================
// ATR CALCULATION (for stops)
// ============================================================================
atr = ta.atr(atrStopLength)

// ============================================================================
// MACD CALCULATION
// ============================================================================
res = useCurrentRes ? timeframe.period : resCustom

fastMA = ta.ema(source, fastLength)
slowMA = ta.ema(source, slowLength)

macd = fastMA - slowMA
signal = ta.sma(macd, signalLength)
hist = macd - signal

// Multi-timeframe MACD
outMacD = request.security(syminfo.tickerid, res, macd, gaps=barmerge.gaps_off, lookahead=barmerge.lookahead_off)
outSignal = request.security(syminfo.tickerid, res, signal, gaps=barmerge.gaps_off, lookahead=barmerge.lookahead_off)
outHist = request.security(syminfo.tickerid, res, hist, gaps=barmerge.gaps_off, lookahead=barmerge.lookahead_off)

// ============================================================================
// HISTOGRAM COLOR LOGIC
// ============================================================================
histA_IsUp = outHist > outHist[1] and outHist > 0
histA_IsDown = outHist < outHist[1] and outHist > 0
histB_IsDown = outHist < outHist[1] and outHist <= 0
histB_IsUp = outHist > outHist[1] and outHist <= 0

// MACD Color Definitions
macd_IsAbove = outMacD >= outSignal
macd_IsBelow = outMacD < outSignal

plot_color = hist_colorChange ? (histA_IsUp ? color.aqua : histA_IsDown ? color.blue : histB_IsDown ? color.red : histB_IsUp ? color.maroon : color.yellow) : color.gray
macd_color = macd_colorChange ? (macd_IsAbove ? color.lime : color.red) : color.red
signal_color = macd_colorChange ? (macd_IsAbove ? color.yellow : color.yellow) : color.lime

// ============================================================================
// CROSSOVER DETECTION
// ============================================================================
macdCross = ta.cross(outMacD, outSignal)
bullCross = ta.crossover(outMacD, outSignal)
bearCross = ta.crossunder(outMacD, outSignal)

// Histogram Strength Filter
histStrong = math.abs(outHist) > minHistStrength

// ============================================================================
// PLOTTING
// ============================================================================
plot(smd ? outMacD : na, title="MACD", color=macd_color, linewidth=4)
plot(smd ? outSignal : na, title="Signal Line", color=signal_color, linewidth=2)
plot(sh ? outHist : na, title="Histogram", color=plot_color, style=plot.style_histogram, linewidth=4)
plotshape(sd and macdCross ? outSignal : na, title="Cross", style=shape.circle, location=location.absolute, color=macd_color, size=size.small)
hline(0, '0 Line', linestyle=hline.style_solid, linewidth=2, color=color.white)

// Plot ADX for reference (in separate pane would be ideal, but showing value)
plot(useADX ? adx : na, title="ADX", color=color.new(color.orange, 0), linewidth=2)
hline(adxThreshold, "ADX Threshold", color=color.new(color.orange, 50), linestyle=hline.style_dashed)

// ============================================================================
// STRATEGY LOGIC
// ============================================================================
// Trend Filter Conditions
longTrendOK = not trendFilter or outMacD > 0
shortTrendOK = not trendFilter or outMacD < 0

// SuperTrend Filter Conditions
longSuperTrendOK = not useSuperTrend or isBullishTrend
shortSuperTrendOK = not useSuperTrend or isBearishTrend

// ADX Filter Condition
adxOK = not useADX or strongTrend

// Volume Filter Condition
volumeOK = not useVolumeFilter or goodVolume

// Entry Conditions (with all filters)
longCondition = bullCross and longTrendOK and longSuperTrendOK and adxOK and volumeOK and histStrong
shortCondition = bearCross and shortTrendOK and shortSuperTrendOK and allowShorts and adxOK and volumeOK and histStrong

// Exit Conditions
longExitCondition = exitOnOpposite and bearCross
shortExitCondition = exitOnOpposite and bullCross
longSTExit = exitOnSTReversal and isBearishTrend
shortSTExit = exitOnSTReversal and isBullishTrend

// ============================================================================
// EXECUTE TRADES
// ============================================================================
// Long Entries
if longCondition and strategy.position_size == 0
    strategy.entry("Long", strategy.long)

// Short Entries
if shortCondition and strategy.position_size == 0
    strategy.entry("Short", strategy.short)

// Exits - Signal-based
if (longExitCondition or longSTExit) and strategy.position_size > 0
    strategy.close("Long", comment="Exit Long")

if (shortExitCondition or shortSTExit) and strategy.position_size < 0
    strategy.close("Short", comment="Exit Short")

// ============================================================================
// STOP LOSS & TAKE PROFIT MANAGEMENT
// ============================================================================
// Long Position Management
if strategy.position_size > 0
    // ATR-based Stop Loss
    if useATRStop
        stopPrice = strategy.position_avg_price - (atr * atrStopMultiplier)
        strategy.exit("ATR SL Long", "Long", stop=stopPrice)

    // Fixed % Stop Loss (backup)
    if useFixedSL and not useATRStop
        strategy.exit("SL Long", "Long", stop=strategy.position_avg_price * (1 - slPercent/100))

    // Take Profit
    if useTP
        strategy.exit("TP Long", "Long", limit=strategy.position_avg_price * (1 + tpPercent/100))

    // Trailing Stop
    if useTrailing
        trailOffset = atr * trailATRMultiplier
        strategy.exit("Trail Long", "Long", trail_price=close - trailOffset, trail_offset=trailOffset)

// Short Position Management
if strategy.position_size < 0
    // ATR-based Stop Loss
    if useATRStop
        stopPrice = strategy.position_avg_price + (atr * atrStopMultiplier)
        strategy.exit("ATR SL Short", "Short", stop=stopPrice)

    // Fixed % Stop Loss (backup)
    if useFixedSL and not useATRStop
        strategy.exit("SL Short", "Short", stop=strategy.position_avg_price * (1 + slPercent/100))

    // Take Profit
    if useTP
        strategy.exit("TP Short", "Short", limit=strategy.position_avg_price * (1 - tpPercent/100))

    // Trailing Stop
    if useTrailing
        trailOffset = atr * trailATRMultiplier
        strategy.exit("Trail Short", "Short", trail_price=close + trailOffset, trail_offset=trailOffset)

// ============================================================================
// VISUAL SIGNALS
// ============================================================================
bgcolor(longCondition ? color.new(color.green, 90) : shortCondition ? color.new(color.red, 90) : na, title="Entry Background")

// SuperTrend visual indicator in MACD pane
stColor = isBullishTrend ? color.new(color.green, 80) : color.new(color.red, 80)
bgcolor(useSuperTrend ? stColor : na, title="SuperTrend Background")

// ADX strength indicator
adxColor = strongTrend ? color.new(color.orange, 90) : color.new(color.gray, 95)
bgcolor(useADX ? adxColor : na, title="ADX Strength Background")
Original indicator by ChrisMoody: CM_MacD_Ult_MTF
Automate Your Trading with PickMyTrade
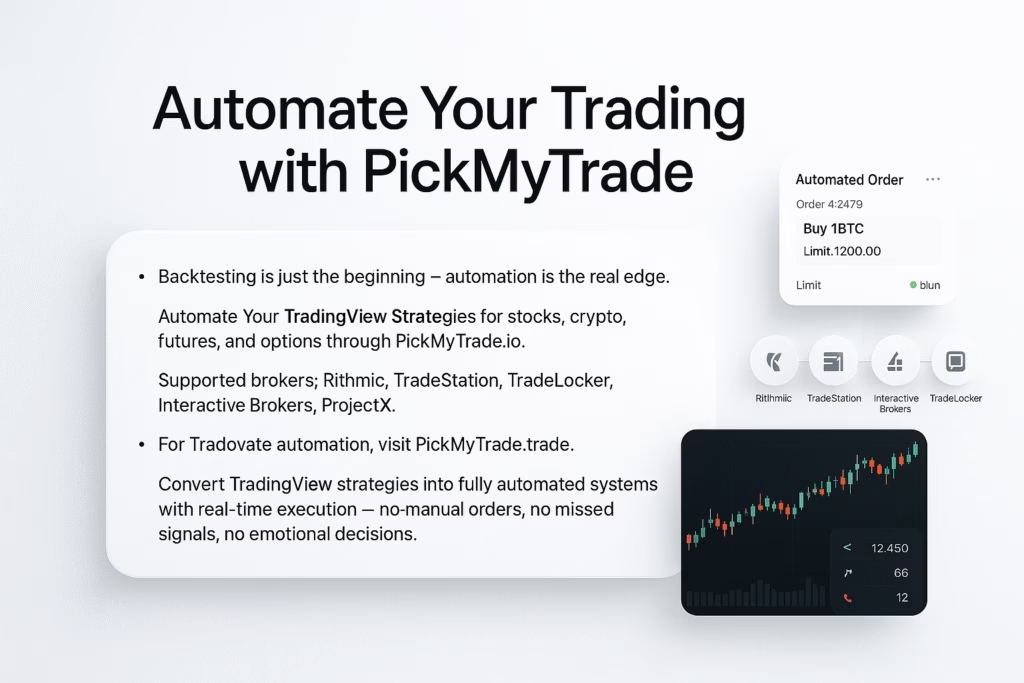
Backtesting is just the beginning. The real power comes from automation.
Automate Your TradingView Strategies
For Stock, Crypto, Futures, and Options: Visit pickmytrade.io to automate your trading across multiple brokers:
- Rithmic
- TradeStation
- TradeLocker
- Interactive Brokers
- ProjectX
For Tradovate Users: Visit pickmytrade.trade for seamless Tradovate broker integration
Transform your TradingView strategies into fully automated trading systems with real-time execution. No more manual order entry, no more missed signals, no more emotional decisions.
Features:
- Real-time alert-to-order execution
- No coding required
- Multi-strategy management
- Position sizing controls
- Risk management automation
- 24/7 execution capability
- Paper trading mode
- Detailed execution logs
Optimization Tips for Tech Stocks
For High Volatility Stocks (TSLA, PLTR)
- Timeframe: 1H-4H recommended
- MACD: 12/26/9 (default works well)
- SuperTrend: ATR 10, Multiplier 2.5-3.0
- ADX Threshold: 25 (filters choppy periods)
- ATR Stop: 2.0-2.5x (gives room for volatility)
For Steady Growth Stocks (NVDA, AMZN)
- Timeframe: 4H-Daily for swing trades
- MACD: 12/26/9
- SuperTrend: ATR 10, Multiplier 3.0
- ADX Threshold: 25
- ATR Stop: 2.0x (tighter stops work better)
General Guidelines
- Start with 4H timeframe for lower trade frequency
- Use 1H timeframe if you can monitor positions actively
- Always enable all 5 filters initially
- Adjust histogram strength (0.3-0.8) based on desired trade frequency
Final Thoughts
We’ve taken one of TradingView’s most legendary indicators and converted it into a fully automated, professionally optimized trading strategy. The results speak for themselves – with profit factors ranging from 1.11 to 1.843 and returns ranging from 34% to 334% across multiple timeframes.
The addition of five professional-grade filters (ADX, SuperTrend, Volume, Histogram Strength, and ATR Stops) has transformed ChrisMoody’s excellent indicator into a robust trading system that:
- Avoids choppy markets (ADX filter)
- Confirms trend direction (SuperTrend filter)
- Ensures institutional participation (Volume filter)
- Eliminates weak signals (Histogram strength filter)
- Adapts to volatility (ATR-based stops)
Credits:
- Original Indicator: ChrisMoody – “CM_MacD_Ult_MTF” (April 10, 2014)
- Strategy Enhancement: PickMyTrade Team
Special thanks to ChrisMoody for creating one of the most comprehensive and visually intuitive MACD indicators on TradingView. His innovative 4-color histogram system has helped millions of traders, and we’re honored to build upon his excellent work.
Remember:
- Backtest results are historical and don’t guarantee future performance
- Always practice proper risk management (1-2% per trade)
- Test the strategy on a demo account before going live
- Start with all filters enabled (conservative approach)
- Consider using automation to eliminate emotional trading decisions
- ADX filter is your best friend – don’t disable it
- Higher timeframes generally produce better risk/reward ratios
The combination of a robust strategy, multiple confirmation filters, and automated execution gives you the best chance at consistent trading success.
Ready to Take Your Trading to the Next Level?
Download the strategy from TradingView and explore automation options at PickMyTrade.
Disclaimer: Trading involves substantial risk of loss. Past performance does not guarantee future results. The backtest results shown are based on historical data and may not reflect actual trading conditions including slippage, commissions, and market impact. Always trade responsibly, use proper risk management, and never risk more than you can afford to lose. This content is for educational purposes only and is not financial advice. Test thoroughly on paper/demo accounts before live trading.