Looking to improve your automated trade setups? Do you want to catch high-probability long entries before the crowd? The hidden bullish divergence pattern can signal trend continuation during pullbacks—especially when visualized on Tradovate charts and executed with an automated trading tool like PickMyTrade.
This strategy is ideal for automated futures trading, giving you precision and speed.
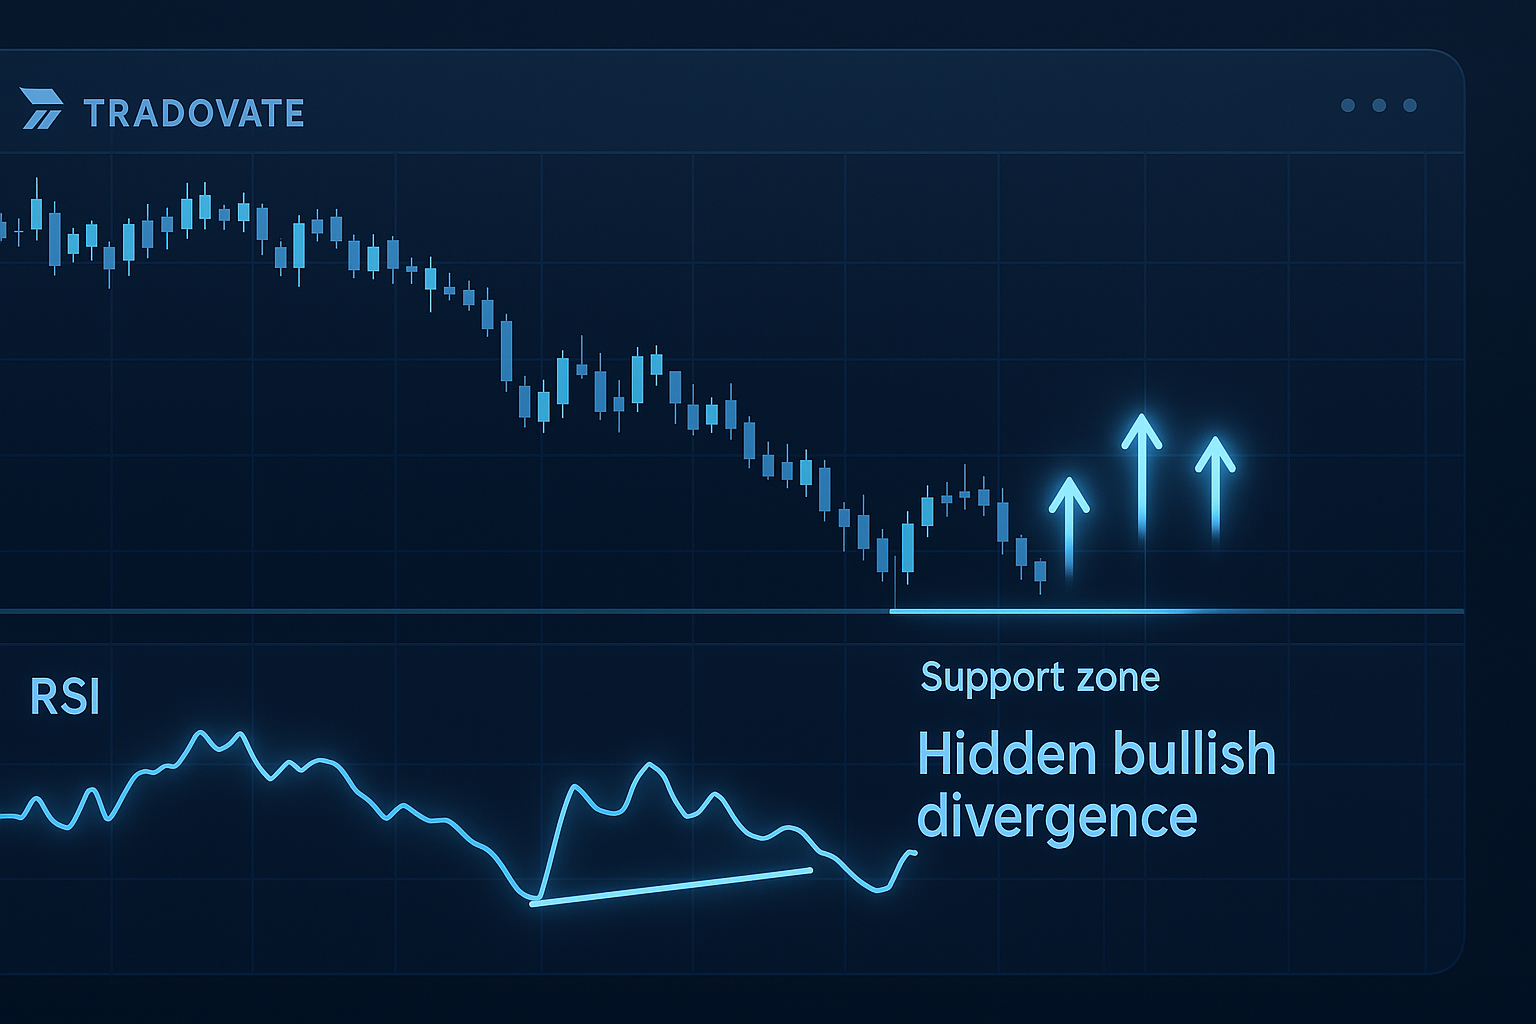
What is Hidden Bullish Divergence?
Hidden bullish divergence appears in an uptrend when:
- Price makes a higher low
- RSI makes a lower low
This shows that while momentum temporarily drops, buyers are still in control and the uptrend is likely to resume.
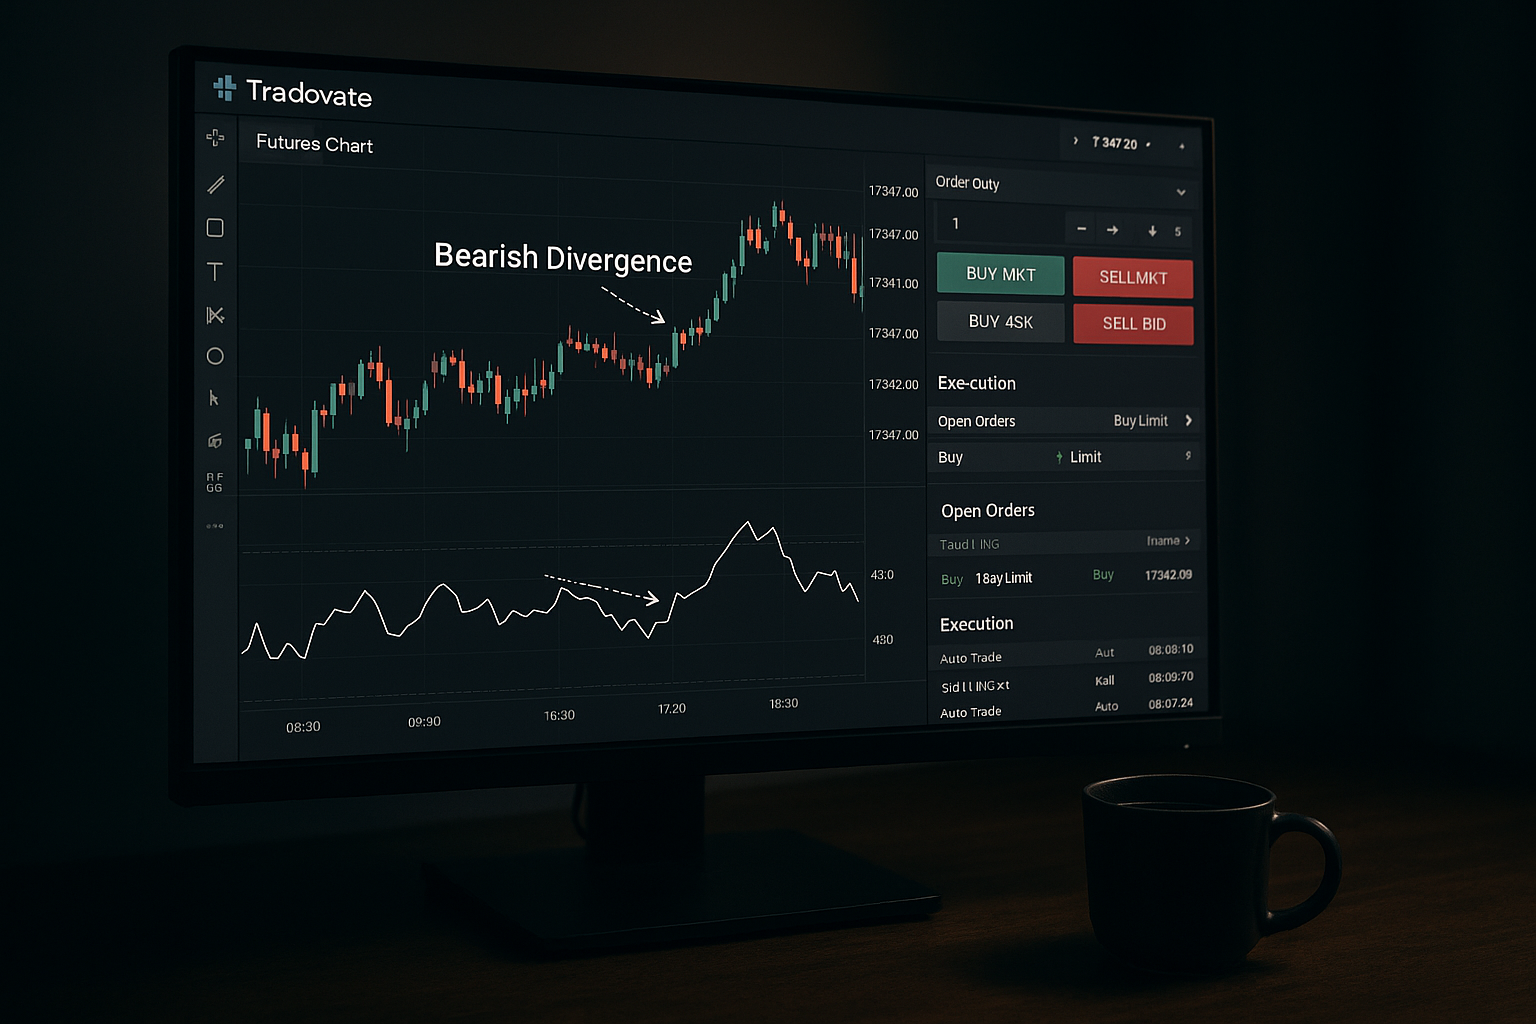
How to Spot It on Tradovate Charts
You can detect hidden bullish divergence using Tradovate charting tools or TradingView connected to Tradovate:
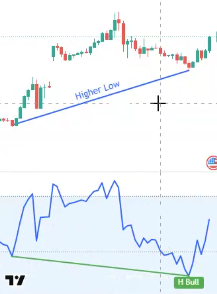
- Identify an Uptrend: The price should generally be making higher highs and higher lows.
- Watch the Pullback: Price pulls back but makes a higher low.
- Check the RSI: RSI forms a lower low, showing momentum dipped.
- Wait for a Bullish Candle: After divergence forms, confirm with a bullish candle close.
You can also use PickMyTrade’s divergence detector to automate this signal.
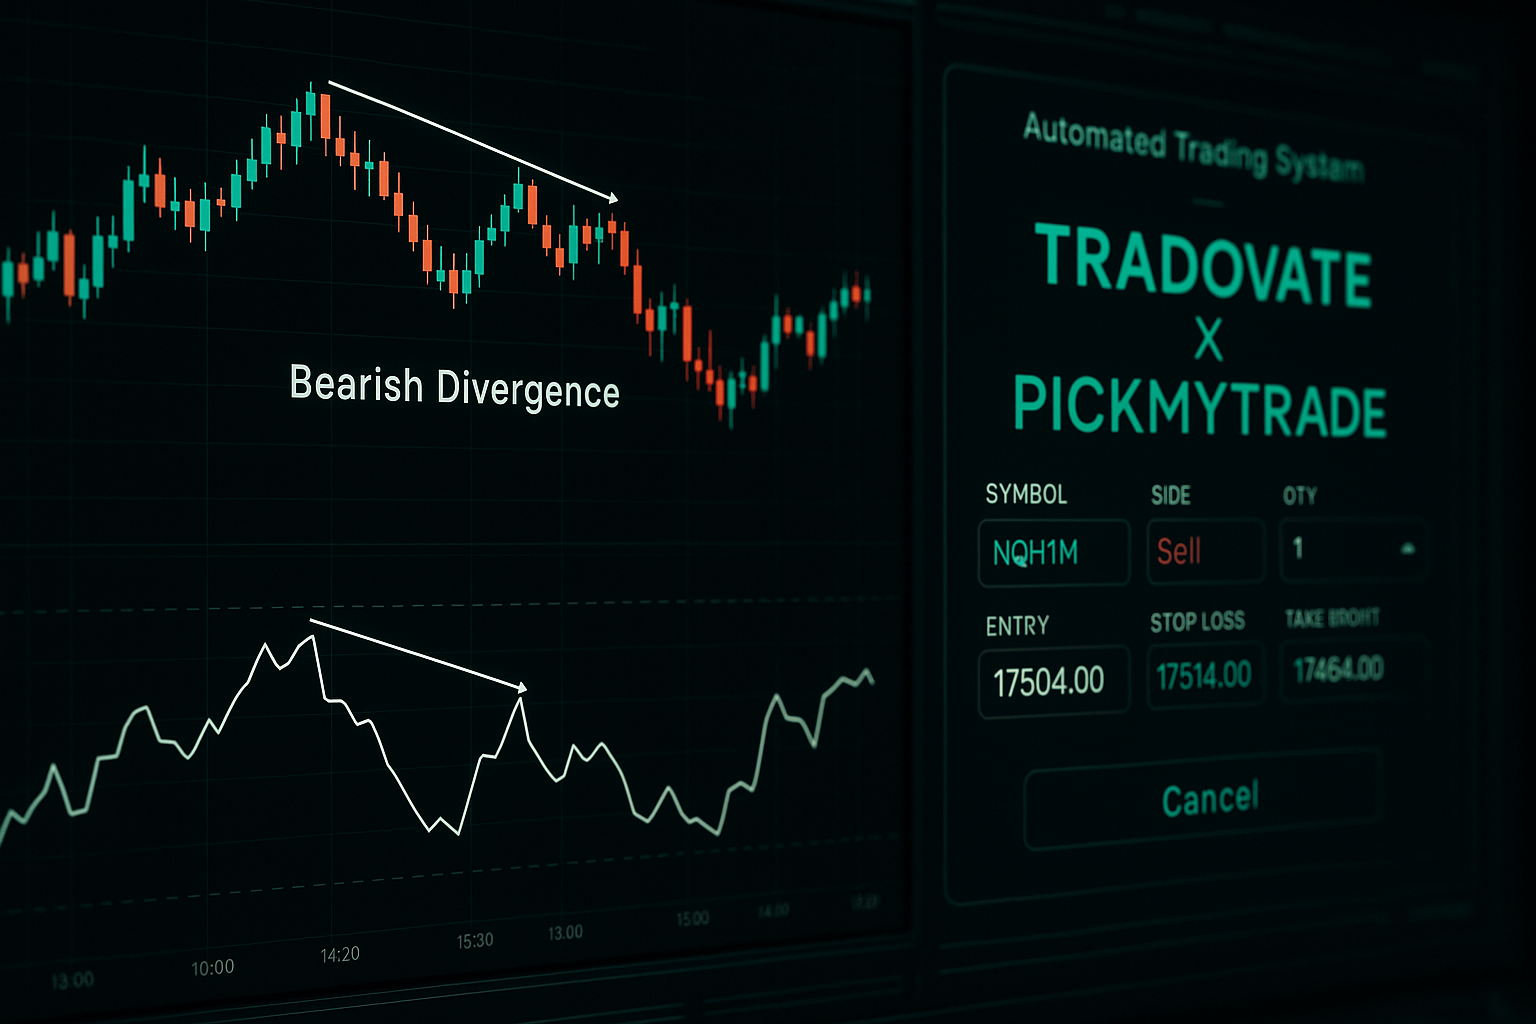
Trade Setup with Automated Futures Execution
Once you confirm the setup, here’s how to automate the trade with PickMyTrade:
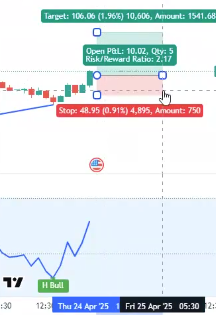
- Entry Rule: After a bullish candle closes post-divergence, enter long using your auto trading tool.
- Stop Loss: Set just below the recent swing low.
- Take Profit: Target the next resistance level, maintaining a 2:1 reward-to-risk ratio.
This setup can be configured in PickMyTrade to work across brokers like Tradovate, Rithmic, TradeLocker, and Interactive Brokers.
Why Use Automation?
Trading hidden bullish divergence manually requires focus and fast action. Using PickMyTrade’s automated trading tool connected to Tradovate helps you:
- Spot RSI signals instantly
- Avoid emotional entries
- Place trades faster
- Improve trade consistency
- Backtest divergence setups easily
Example: Hidden Bullish Divergence in Action
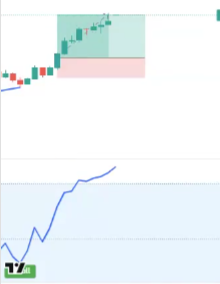
- The price of a futures asset is trending upward.
- During a pullback, it forms a higher low.
- RSI prints a lower low.
- You set an auto entry via PickMyTrade after a bullish engulfing candle.
As price rebounds, your automated futures trade hits profit while you stay hands-free.
Final Thoughts: Automate Your Edge
Hidden bullish divergence is a powerful signal that most miss. When paired with Tradovate charts and executed through an auto trading tool like PickMyTrade, it becomes a strategy that you can automate, scale, and repeat.
Want to trade smarter, not harder?
Set up hidden divergence detection on PickMyTrade and connect your Tradovate account for seamless, automated entries.
Also Checkout: Automate TradingView Indicators with Tradovate Using PickMyTrade