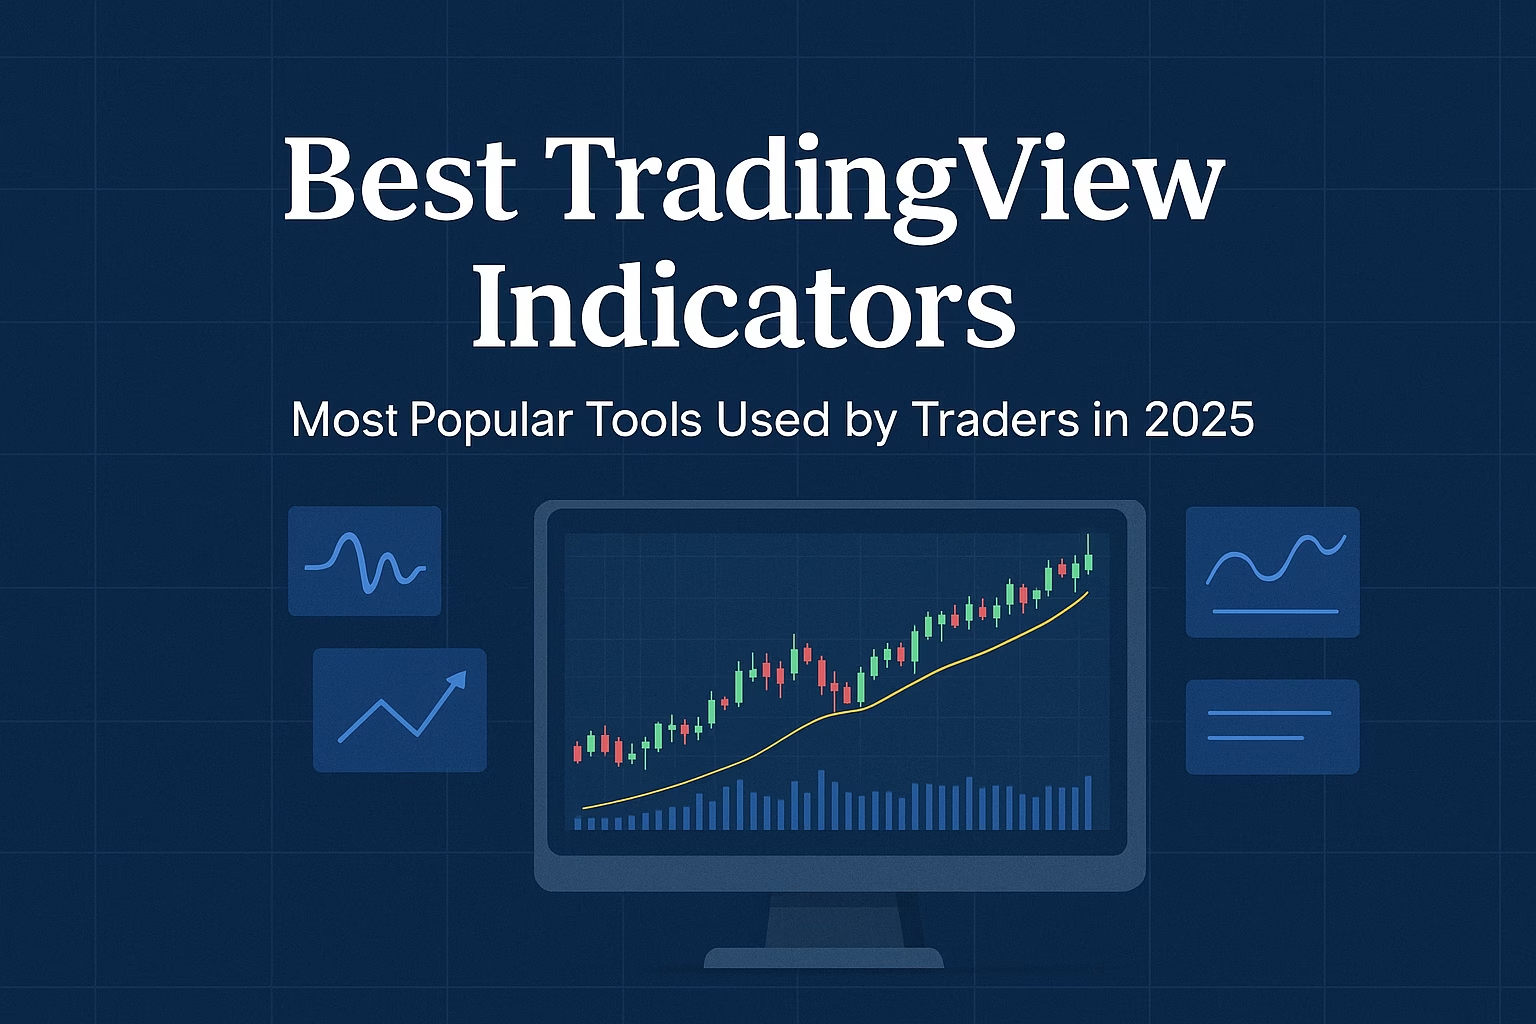
TradingView is a popular charting platform used by over 60 million traders. It offers hundreds of indicators, but some are especially effective and widely used.
In this guide, we’ll explore the best and most popular TradingView indicators for 2025, covering trend-following, momentum, volatility, support/resistance, and volume-based tools that traders rely on to make informed decisions.
Why Choosing the Right Indicator Matters
The most popular indicators aren’t just widely used—they’re effective. A good trading indicator should be:
- Reliable: Provides consistent signals across various market conditions.
- Clear: Easy to read and interpret.
- Versatile: Works across multiple markets and timeframes.
- Aligned with your trading style: Suitable for day trading, swing trading, or trend-following strategies.
Additionally, combining complementary indicators can reduce false signals and improve the accuracy of your trades.
1. Relative Strength Index (RSI)
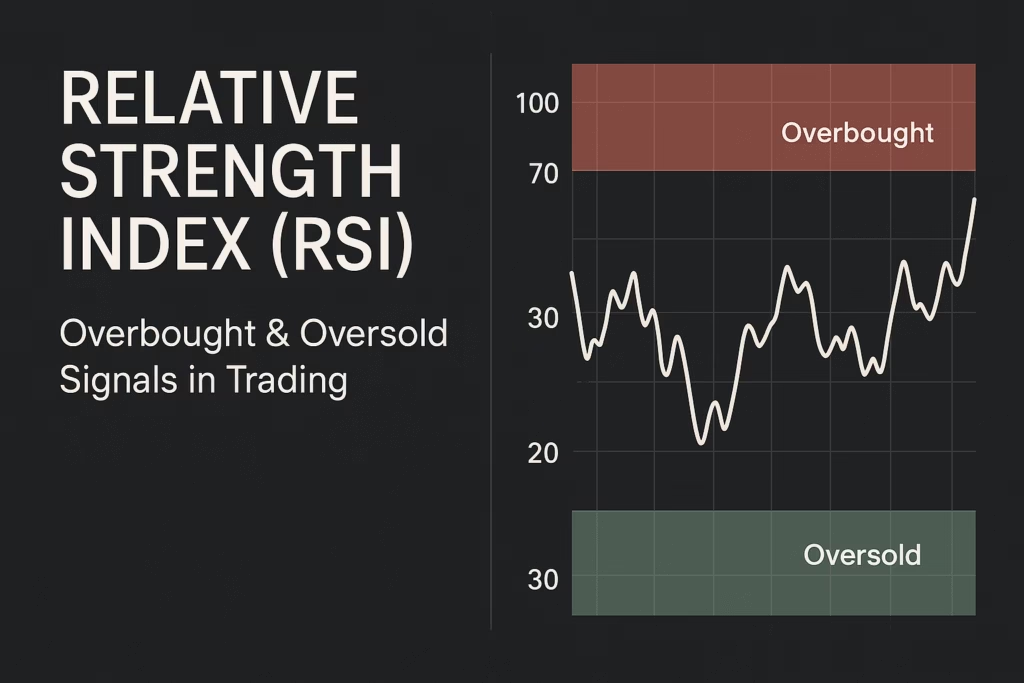
The RSI is one of the most popular momentum indicators on TradingView. It measures the speed and change of price movements on a scale from 0 to 100.
- Overbought/Oversold Levels: Values above 70 suggest overbought conditions; below 30 suggest oversold.
- Trend Confirmation: RSI above 50 during uptrends and below 50 during downtrends.
- Practical Use: Often combined with Bollinger Bands or MACD to confirm entry and exit points.
Why traders love it: RSI is simple, effective, and widely trusted for spotting potential reversals.
2. Moving Average Convergence Divergence (MACD)
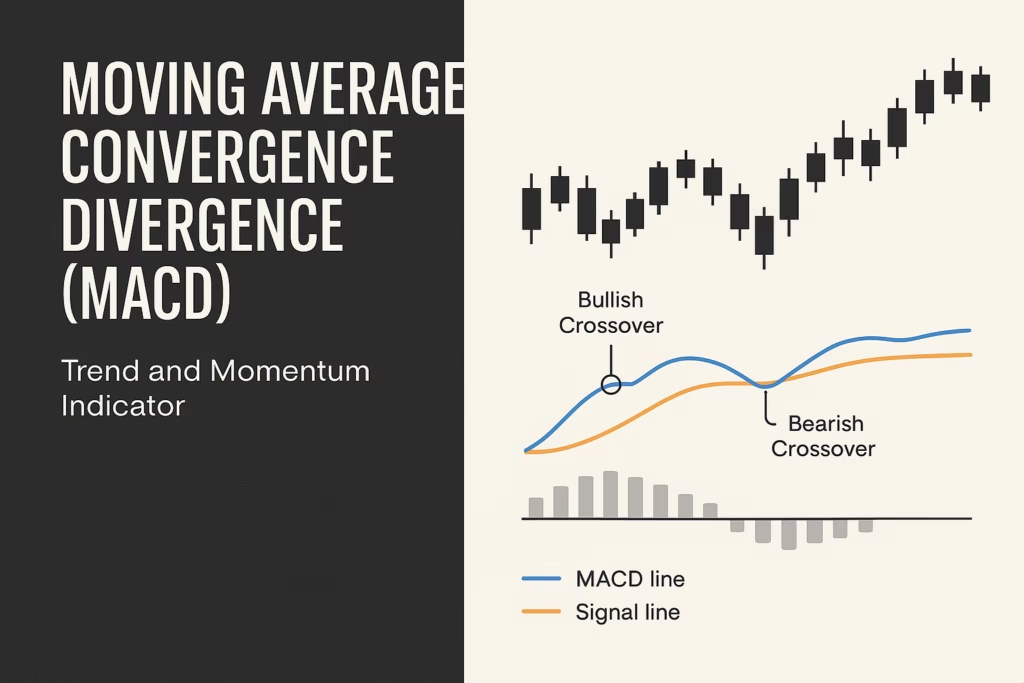
MACD is a trend-following and momentum indicator that remains one of the most popular tools on TradingView.
- Structure: The 12-period EMA minus the 26-period EMA forms the MACD line; a 9-period EMA acts as the signal line.
- Key Signals:
- Crossover: MACD line above signal = bullish; below = bearish.
- Zero Line: Above zero = bullish momentum; below zero = bearish.
Why traders love it: MACD combines trend and momentum in one indicator, making it versatile and widely used for trend confirmation.
3. Bollinger Bands
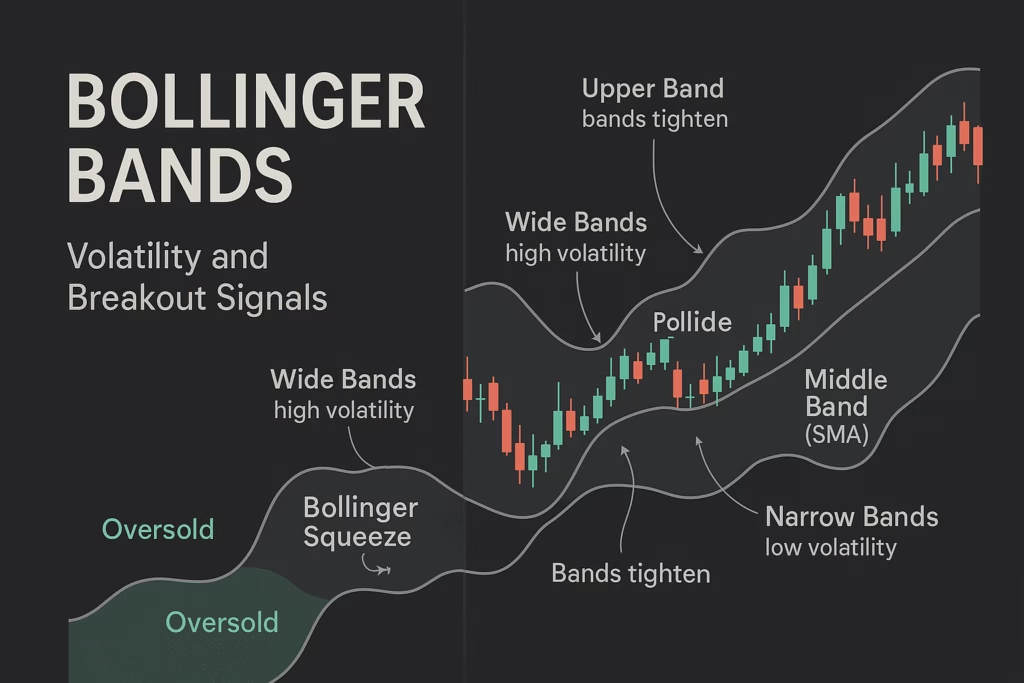
Bollinger Bands measure volatility and are a favorite among traders for visualizing price extremes.
- High vs. Low Volatility: Wide bands = high volatility; narrow bands = low volatility.
- Trading Signals: Price touching the upper band may indicate overbought; lower band may indicate oversold.
- Bollinger Squeeze: A tightening of the bands often precedes strong breakouts.
Why traders love it: It helps anticipate breakouts and potential reversals in trending and ranging markets.
4. Moving Averages (MA)
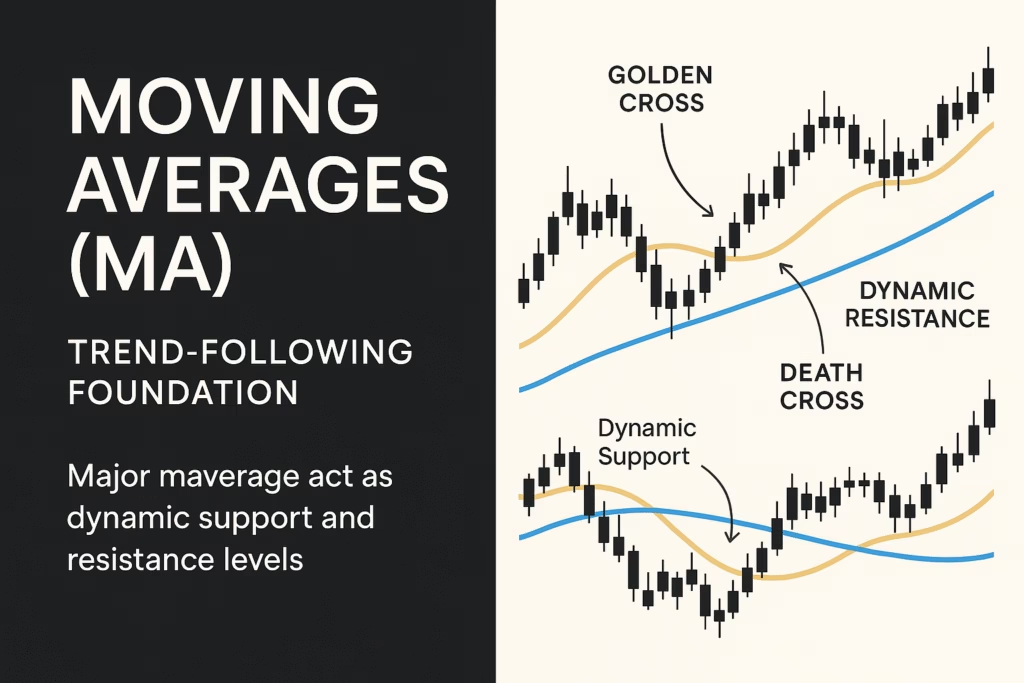
Moving Averages are foundational trend-following tools and among the most widely used indicators on TradingView.
- Types: Simple (SMA) or Exponential (EMA).
- Popular Crossovers:
- Golden Cross: Short-term MA crosses above long-term MA → bullish signal.
- Death Cross: Short-term MA crosses below long-term MA → bearish signal.
- Dynamic Support/Resistance: Major MAs often act as bounce points for price.
Why traders love it: MAs provide clear trend direction and dynamic levels for entries and exits.
5. VWAP & Volume Indicators
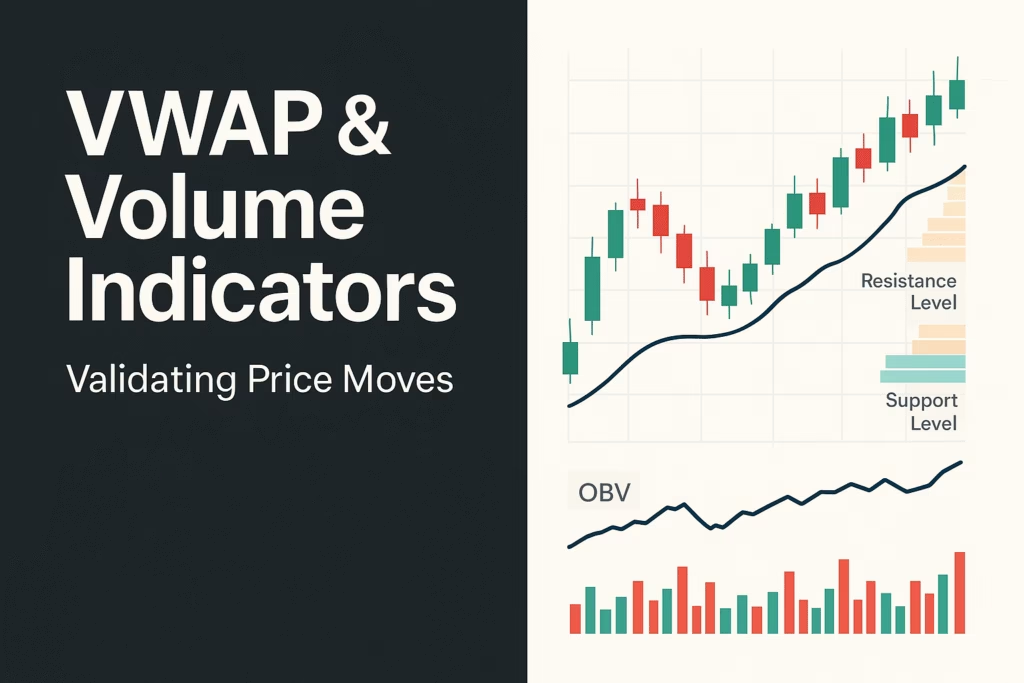
Volume-based indicators validate price moves and market participation.
- VWAP (Volume Weighted Average Price): Price above VWAP = bullish; below = bearish.
- OBV (On-Balance Volume): Rising OBV signals buying pressure; falling OBV signals selling pressure.
- Volume Profile: Highlights high-volume price levels that often act as support or resistance.
Why traders love it: Volume indicators confirm breakouts and trends, providing confidence in trade decisions.
6. Fibonacci Retracements & Pivot Points
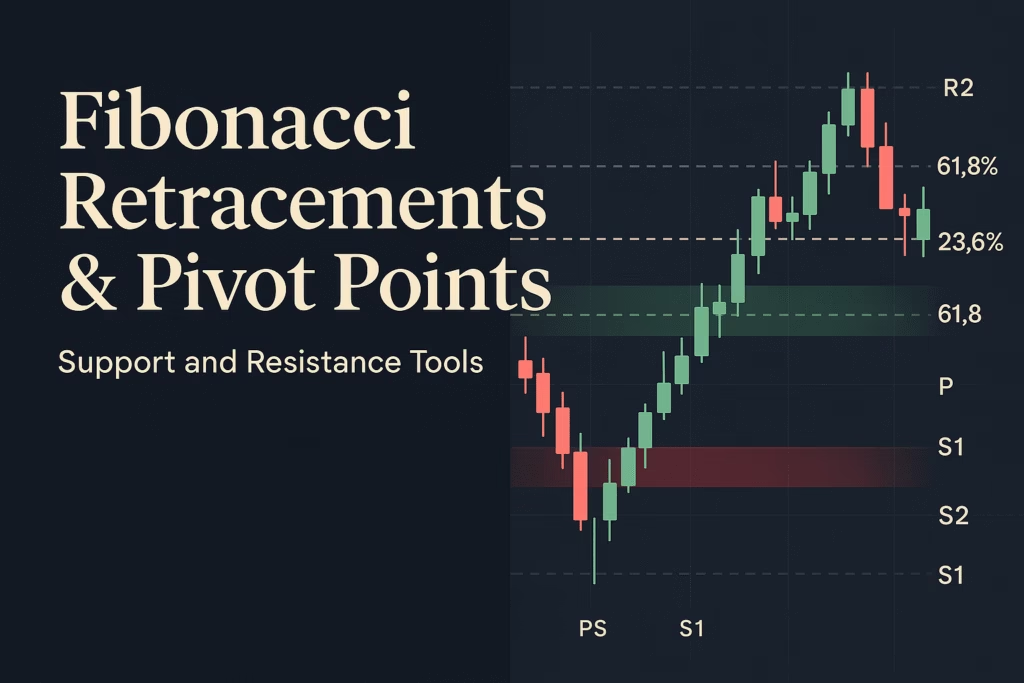
Support and resistance tools help traders plan precise entries and exits.
- Fibonacci Retracement: Levels like 23.6%, 38.2%, and 61.8% indicate likely pullback zones.
- Pivot Points: Daily or weekly pivot levels (S1, S2, R1, R2) often act as turning points.
Why traders love it: These tools are widely used for targeting entries, exits, and stop-loss placement.
7. Ichimoku Cloud
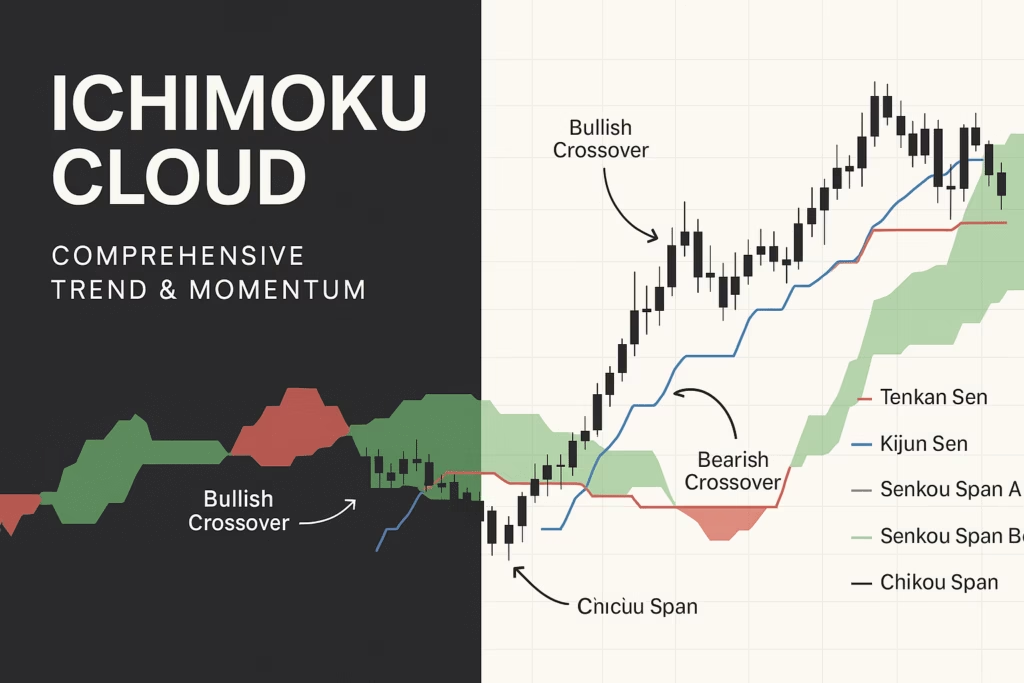
The Ichimoku Kinko Hyo, or Ichimoku Cloud, is a comprehensive trend and momentum indicator.
- Visual Cues: Price above the cloud = bullish; below = bearish.
- Components: Tenkan Sen, Kijun Sen, Senkou Span A/B, and Chikou Span.
- Trend Signals: Crossovers of Tenkan and Kijun lines signal potential trend changes.
Why traders love it: It provides a full-picture analysis of trend, momentum, and support/resistance in one glance, especially useful on higher timeframes.
Key Takeaways
- No single indicator is perfect—combine tools for confirmation.
- Popular combinations include Trend + Momentum or Volatility indicators.
- Adapt indicators to market conditions (trending, ranging, or volatile).
- Implement strict risk management: use stop-losses and position sizing.
The best and most popular TradingView indicators are those that fit your strategy and provide actionable insights. Test, combine, and customize them for maximum trading effectiveness in 2025.
Take It Further: Automate Your TradingView Strategies with PickMyTrade
Once you’ve chosen the right indicator or strategy on TradingView, the next challenge is execution especially if you’re managing multiple accounts or working through prop firm evaluations. Manual execution can lead to slippage, missed signals, and inconsistent results.
That’s where PickMyTrade comes in.
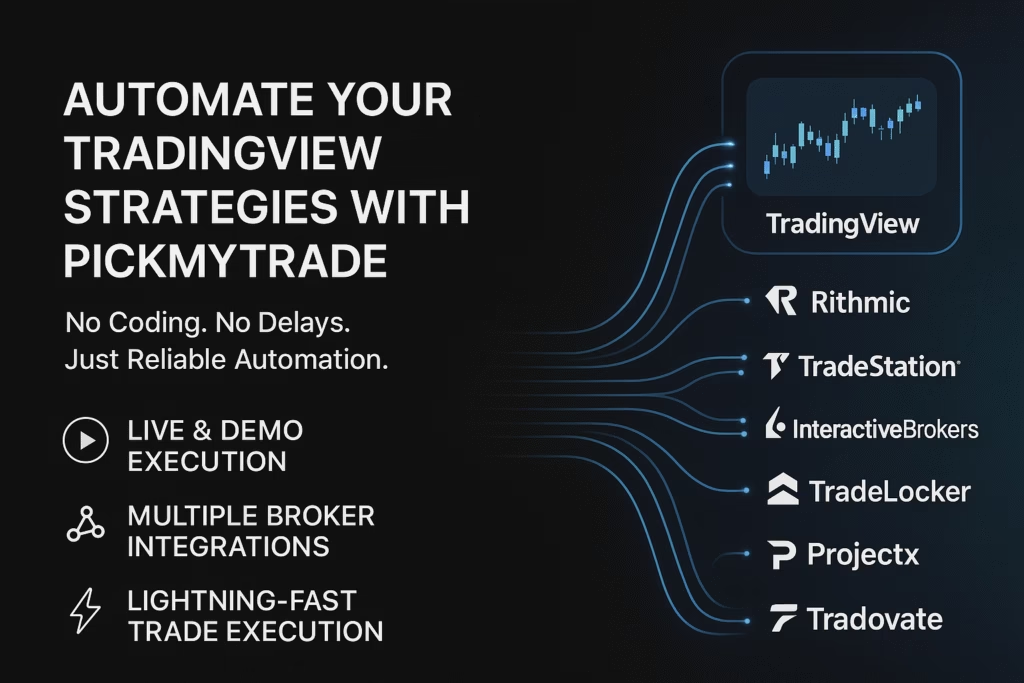
PickMyTrade connects directly to your TradingView strategies, enabling real-time, automated trade execution across supported brokers. No coding. No delays. Just reliable automation that keeps your strategy running exactly as intended.
Whether you’re scalping, swing trading, or running a fully automated system, PickMyTrade supports:
- Live and demo execution
- Multiple broker integrations including Rithmic, TradeStation, Interactive Brokers, TradeLocker & Projectx.
- Lightning-fast strategy execution with zero lag from TradingView alerts
To start automating your TradingView strategies, visit PickMyTrade.io.
Using Tradovate? Head to PickMyTrade.trade for seamless Tradovate integration.
You May also Like:
Best TradingView Indicators and Strategies: Free and Premium Tools for All Traders
Top Free Indicators and Strategies on TradingView
Best AI Tools for Trading: Signal Generation, Strategy Building, and Automation
1. What is the best indicator for 2025 TradingView?
The best TradingView indicator depends on your trading style and strategy. Popular choices for 2025 include RSI, MACD, Bollinger Bands, Moving Averages, VWAP, Fibonacci Retracement, Pivot Points, and Ichimoku Cloud. Traders often combine multiple indicators for higher accuracy.
2. What is the most successful indicator in TradingView?
Success depends on market context, but RSI, MACD, and Bollinger Bands are widely regarded as the most reliable and widely used indicators. Combining trend, momentum, and volume indicators often improves overall success.
3. What is the 99% accuracy indicator on TradingView?
No indicator guarantees 99% accuracy. Indicators like RSI, MACD, or VWAP can provide high-probability signals when used with proper risk management and confirmation from other tools, but all indicators have limitations.
4. What is the most powerful indicator?
Ichimoku Cloud is considered powerful because it combines trend, momentum, and support/resistance in one visual tool. Other powerful indicators include MACD for trend/momentum and VWAP for volume-based validation.
5. What are the “Big 3” indicators?
The “Big 3” most commonly used indicators are:
- RSI – Momentum
- MACD – Trend & momentum
- Bollinger Bands – Volatility
These cover the essential aspects of market analysis.
6. Which indicator has high accuracy or the highest win rate?
Accuracy depends on market conditions and timeframe. RSI, MACD, and VWAP are widely used for higher win rates when combined with other indicators. No single indicator guarantees 100% win rate.
7. Is Lux Algo good for beginners?
Yes, Lux Algo is beginner-friendly. It provides buy/sell signals and trend analysis, making it easier for new traders to interpret the market without deep technical knowledge.
8. What strategy has a 90% win rate?
No strategy guarantees a 90% win rate consistently. High-probability strategies combine trend-following, momentum, and risk management, often using indicators like RSI, MACD, Bollinger Bands, and Moving Averages.
9. Which indicator gives buy and sell signals?
Lux Algo, MACD crossovers, RSI extremes, and Bollinger Band touches are commonly used to generate buy and sell signals. Volume indicators like VWAP can confirm these signals.
10. How to use AI in TradingView?
AI can be used for predictive analytics, signal generation, or strategy automation. Some TradingView scripts integrate AI-based alerts to analyze price patterns and generate buy/sell signals.
11. Which is the most profitable strategy in TradingView?
Profitability depends on risk management, market conditions, and consistency. Combining trend-following (MAs, MACD) with momentum and volatility indicators (RSI, Bollinger Bands) tends to provide the most reliable results.
12. What is the best trade to have in 2025?
The “best trade” varies per trader, but trades confirmed by trend + momentum + volume indicators are usually the highest probability setups. Focus on setups with clear support/resistance, proper risk-reward ratios, and market confirmation.
13. How to do trading in 2025?
Modern trading combines technical analysis, risk management, and strategy testing. Using TradingView indicators, backtesting strategies, and automated alerts are essential steps for efficient trading in 2025.
14. Which indicator is best for future trading?
For futures, popular indicators include VWAP, Moving Averages, MACD, RSI, and Fibonacci retracements, as they help identify trends, high-volume zones, and potential reversals.
15. What is the best indicator to confirm a breakout?
Breakouts are often confirmed using VWAP, Bollinger Bands, or high-volume spikes, ideally combined with trend confirmation from Moving Averages or MACD.
16. Which indicator is better than MACD?
No single indicator is strictly “better,” but Ichimoku Cloud and RSI + trend indicators can sometimes provide more comprehensive insights than MACD alone.
17. Which is the fastest leading indicator?
RSI and Stochastic Oscillator are considered leading indicators because they react quickly to price changes and highlight overbought/oversold conditions.
18. Which free indicator is best for trading?
Some of the best free TradingView indicators include RSI, MACD, Bollinger Bands, Moving Averages, Pivot Points, and VWAP. They are widely used, reliable, and beginner-friendly.
19. What is a buy-sell indicator?
A buy-sell indicator signals potential entry (buy) or exit (sell) points in the market. Examples include Lux Algo, MACD crossovers, RSI extremes, and Bollinger Band touches.