In today’s volatile markets, raw returns tell only half the story. Smart traders and fund managers rely on risk adjusted metrics to rank true performance—separating skilled strategies from those that simply ride luck or excessive risk. As we move through 2026, with hedge funds posting record 12.5% industry returns in 2025 yet facing heightened dispersion and drawdown risks, risk adjusted metrics have never been more critical for futures traders, ETF investors, and automated systems.
This updated guide breaks down the latest on risk adjusted metrics, how to use them for performance ranking, and practical ways to apply them in US futures markets—complete with automation tools that deliver consistent, measurable edges.
What Are Risk Adjusted Metrics and Why Do They Matter for Performance Ranking?
Risk adjusted metrics evaluate returns relative to the volatility or downside risk taken to achieve them. Unlike simple profit percentages, these metrics reveal whether a strategy delivers sustainable alpha or just high-risk bets that could wipe out capital during the next market shock.
In 2026, with AI-driven volatility, geopolitical tensions, and tighter regulations, risk adjusted metrics help traders rank strategies, portfolios, and even prop-firm accounts objectively. They answer the key question: Is the reward worth the risk? High raw returns with massive drawdowns rank poorly; steady, lower-volatility gains often top the leaderboard.
Key Risk Adjusted Metrics Every Trader Must Master
Several core risk adjusted metrics dominate performance rankings in 2026. Here’s how they work:
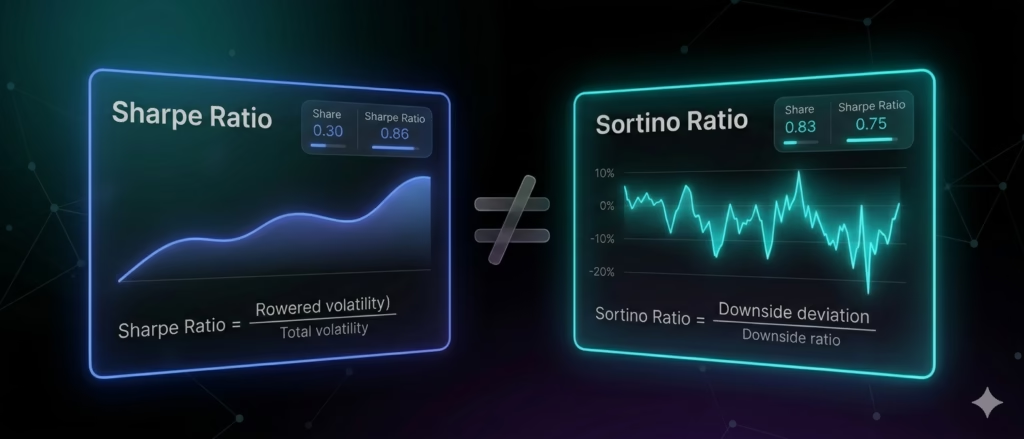
- Sharpe Ratio: Measures excess return per unit of total volatility. Formula: Sharpe Ratio=σpRp−Rf where Rp is portfolio return, Rf is risk-free rate (e.g., current T-bill yield), and σp is standard deviation. A Sharpe > 1.0 is good; > 2.0 is excellent. It remains the industry benchmark for balanced ranking.
- Sortino Ratio: Improves on Sharpe by focusing only on downside volatility—ideal for traders who fear big losses more than upside swings. Formula: Sortino Ratio=σdRp−Rf (where σd is downside deviation). Sortino rankings surged in popularity in 2025-2026 for futures and crypto strategies.
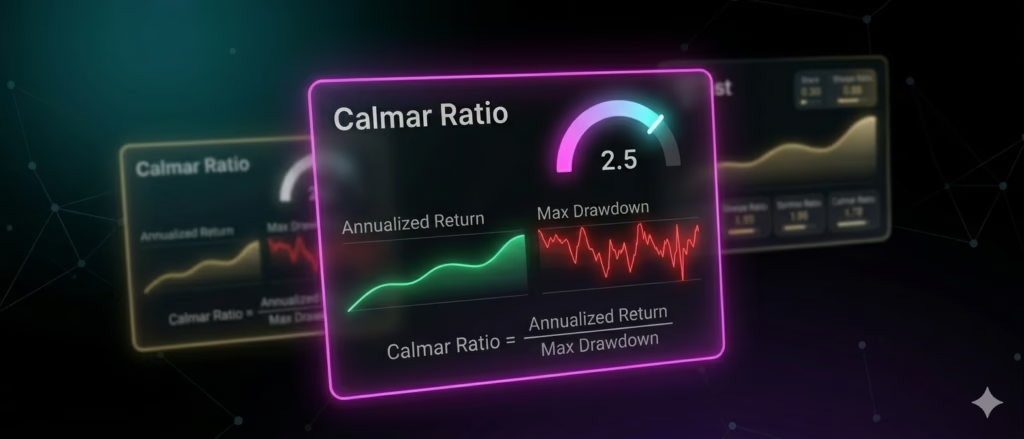
- Calmar Ratio: Best for drawdown-focused ranking. It divides annualized return by maximum drawdown—perfect for futures traders facing margin calls. Formula: Calmar Ratio=Max DrawdownAnnualized Return Calmar > 1.0 signals strong risk control; values above 2.0 rank elite in 2026 hedge-fund and automated trading reports.
- Other powerful metrics: Treynor Ratio (return per unit of market risk via beta), Information Ratio (excess return over benchmark per tracking error), and Profit Factor (gross profit / gross loss). Combine them for comprehensive performance ranking.
In 2026 hedge-fund outlooks, multi-strategy and macro funds lead Calmar and Sortino rankings by minimizing drawdowns while capturing dispersion.
Click Here To Automate Futures Trading
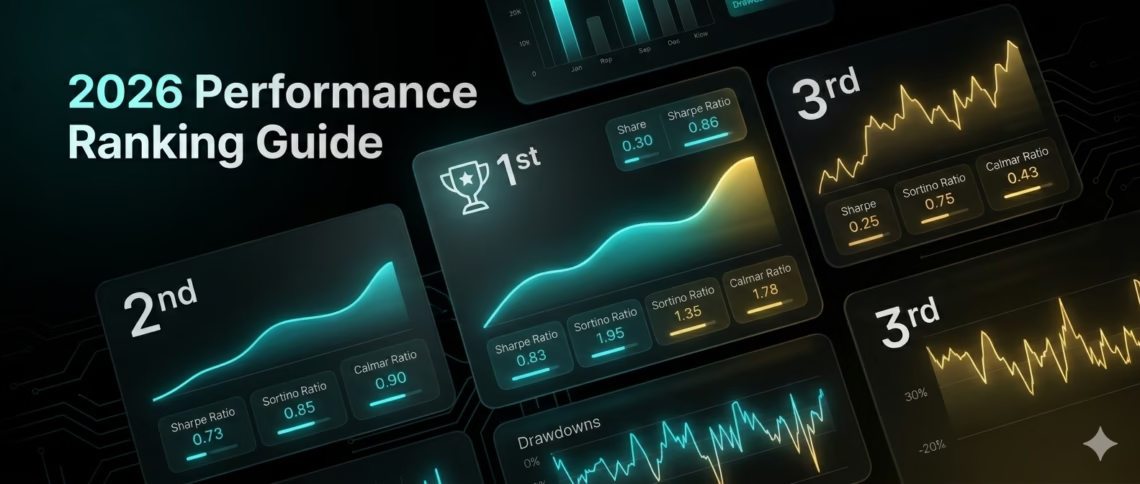
How to Rank Trading Performance Using Risk Adjusted Metrics in 2026
Performance ranking isn’t guesswork. Follow this step-by-step process:
- Gather clean data: Use at least 3 years of daily/weekly returns (or 1+ year for futures).
- Calculate metrics: Tools like Python (with libraries such as pandas and empyrical), TradingView, or portfolio trackers handle the math.
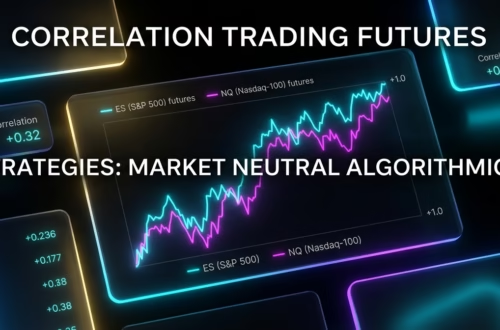
- Benchmark fairly: Compare against relevant indices (S&P 500 for equities, US futures benchmarks like ES/NQ).
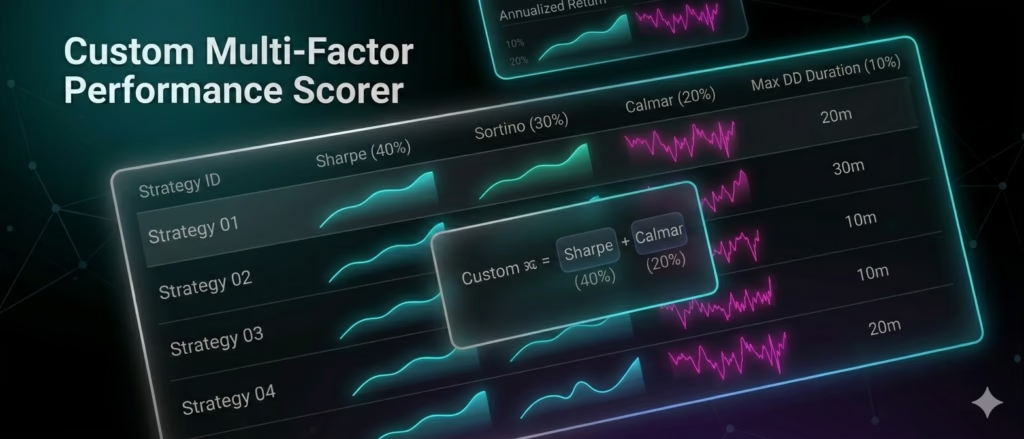
- Rank holistically: Weight Sharpe (40%), Sortino (30%), Calmar (20%), and drawdown duration (10%) for a custom score.
- Stress-test: Run Monte Carlo simulations for 2026 scenarios like inflation spikes or AI-driven flash crashes.
Recent 2025 data shows top-ranked hedge funds delivered double-digit returns with Sharpe ratios above 1.5 and Calmar ratios near 1.2—far outperforming unadjusted “high-return” strategies that crashed in Q4 volatility.
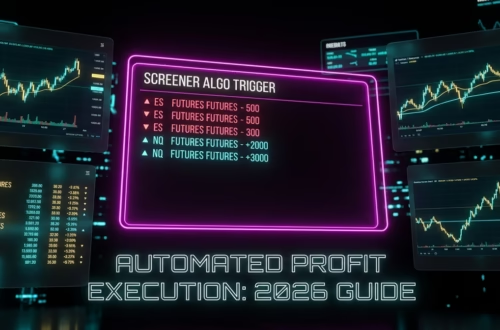
Risk Adjusted Metrics in Automated Futures Trading on US Markets
US futures markets (ES, NQ, CL, GC) offer 24/5 liquidity but punish poor risk control with rapid drawdowns. Here, risk adjusted metrics separate winners: automated systems consistently rank higher than manual trading because they enforce discipline.
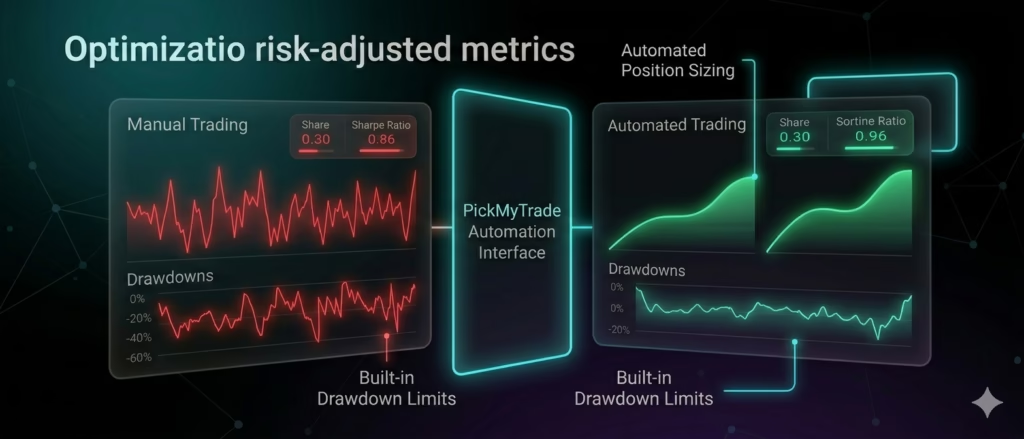
PickMyTrade stands out as a game-changer for futures traders seeking superior risk adjusted metrics. This automation platform bridges TradingView signals directly to brokers like Tradovate, Rithmic, Interactive Brokers, and TradeStation—executing 24/7 with zero emotion.
Key ways PickMyTrade boosts your rankings:
- Automated position sizing based on account equity, ATR volatility, and stop distance—directly lowering standard deviation and improving Sharpe/Sortino ratios.
- Built-in drawdown limits (e.g., auto-liquidation at 3-5% daily or 10-15% max)—dramatically enhancing Calmar ratios.
- Bracket orders, trailing stops, and pre-trade filters for high-impact news, ensuring compliance and consistency in prop-firm challenges.
- Multi-account scaling with real-time analytics—ideal for ranking multiple futures strategies side-by-side.
Traders using PickMyTrade in 2026 report tighter risk controls and more consistent performance in volatile US index futures, turning good strategies into top-ranked ones by minimizing the downside that kills unadjusted returns.
Practical Tips to Skyrocket Your Risk Adjusted Metrics in 2026
- Start with 1-2% risk per trade and automate it.
- Backtest and forward-test every strategy with Sharpe, Sortino, and Calmar targets.
- Diversify across uncorrelated futures contracts.
- Monitor weekly: recalculate metrics and adjust only on data, not emotion.
- Leverage automation platforms like PickMyTrade to remove human error—the #1 drag on risk-adjusted performance.
Conclusion
In 2026, the traders and funds climbing the performance rankings aren’t chasing the highest returns—they’re mastering risk adjusted metrics. Whether you’re day-trading micro E-minis or scaling automated futures systems, these tools deliver sustainable edges.
Ready to rank your portfolio at the top? Integrate risk adjusted metrics today and pair them with smart automation for futures on US markets. The market rewards discipline, not just bold bets.
Most Asked FAQs
What is the difference between Sharpe and Sortino ratios?
Sharpe uses total volatility; Sortino focuses only on harmful downside deviation—making Sortino better for ranking strategies where big losses matter more.
Which risk adjusted metric is best for futures trading?
Calmar Ratio excels for futures because it directly penalizes maximum drawdowns, critical in leveraged markets with margin requirements.
How do I calculate risk adjusted metrics for my trading account?
Export your trade log to Excel or Python, input returns vs. risk-free rate, and use standard formulas or free tools like Portfolio Visualizer.
Can automation improve my risk adjusted metrics?
Absolutely. Platforms like PickMyTrade automate stops, sizing, and drawdown limits, consistently delivering higher Sharpe, Sortino, and Calmar scores.
Disclaimer:
This content is for informational purposes only and does not constitute financial, investment, or trading advice. Trading and investing in financial markets involve risk, and it is possible to lose some or all of your capital. Always perform your own research and consult with a licensed financial advisor before making any trading decisions. The mention of any proprietary trading firms, brokers, does not constitute an endorsement or partnership. Ensure you understand all terms, conditions, and compliance requirements of the firms and platforms you use.
Also Checkout: Connect Tradovate with Trading view using PickMyTrade