Unlocking the Secrets of Trading Charts for Better Decision-Making
Reading trading charts is a fundamental skill for anyone involved in financial markets. Charts provide a visual representation of price movements over time, allowing traders to analyze past performance and predict future trends. Whether you’re new to trading or looking to refine your chart-reading skills, this guide will help you understand the basics of reading charts and how to use them to make informed trading decisions.
Understanding the Basics of Trading Charts
- Types of Charts
- Line Chart: Connects closing prices with a continuous line. It’s simple and provides a clear view of the overall trend.
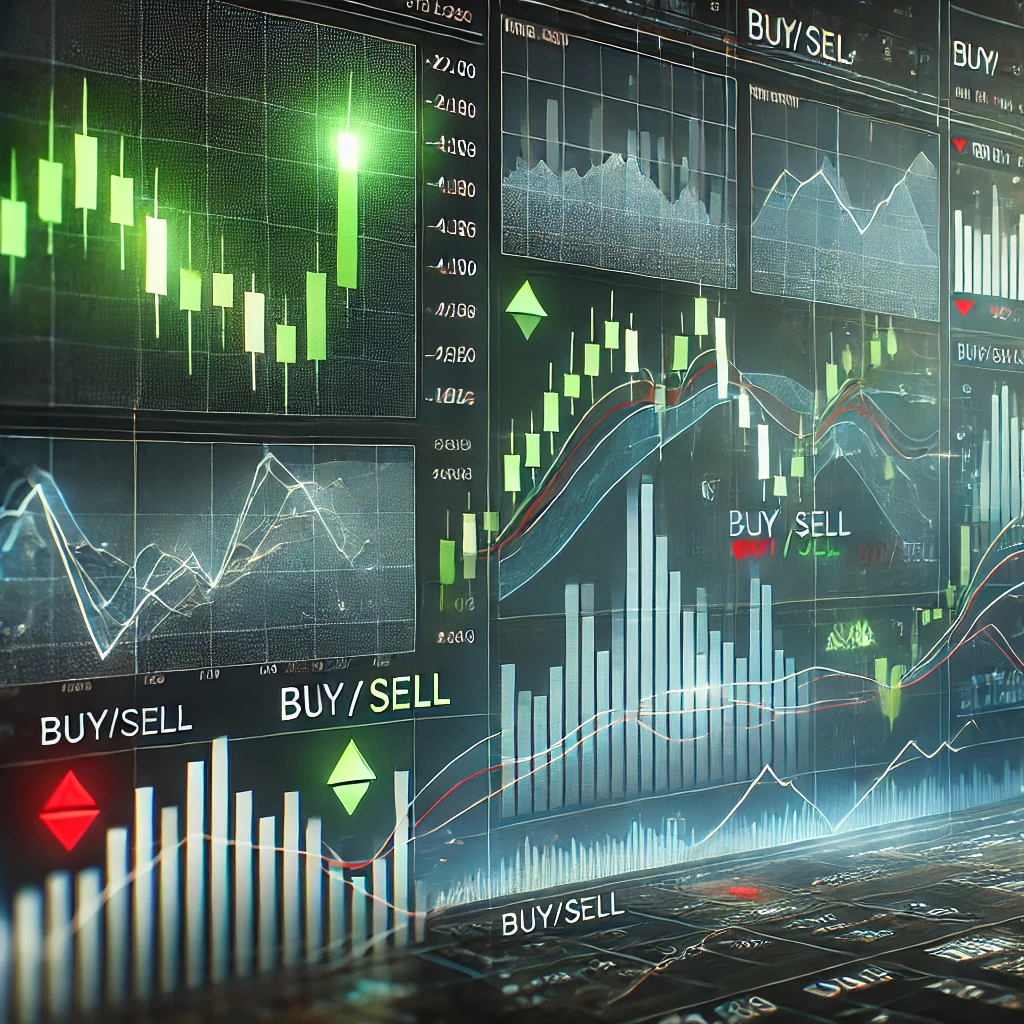
- Bar Chart: Displays the open, high, low, and close prices for each period. The top of the bar represents the high, the bottom represents the low, the left notch shows the open, and the right notch shows the close.
- Candlestick Chart: Similar to bar charts but with a more visually appealing representation. The body of the candlestick shows the range between the open and close, while the wicks show the high and low.
- Time Frames
- Intraday: Includes time frames like 1-minute, 5-minute, and 15-minute charts, useful for day trading.
- Daily: Represents price movements within a single trading day, commonly used by swing traders.
- Weekly/Monthly: Shows longer-term trends and is useful for investors and long-term traders.
Key Components of a Trading Chart
- Price Axis (Y-Axis)
- Shows the price levels of the asset being traded.
- Time Axis (X-Axis)
- Displays the time period over which the price movements are plotted.
- Volume
- Indicates the number of shares or contracts traded during a specific time period. High volume often accompanies significant price movements.
Essential Chart Patterns
- Trend Lines
- Drawn to connect significant highs or lows to identify the direction of the market. An upward trend line connects higher lows, while a downward trend line connects lower highs.
- Support and Resistance Levels
- Support: A price level where a downtrend can be expected to pause due to a concentration of demand.
- Resistance: A price level where an uptrend can be expected to pause due to a concentration of supply.
- Moving Averages
- Simple Moving Average (SMA): Calculated by averaging the closing prices over a specific number of periods. It helps smooth out price data and identify trends.
- Exponential Moving Average (EMA): Similar to SMA but gives more weight to recent prices, making it more responsive to new information.
- Candlestick Patterns
- Bullish Patterns: Indicate potential upward movement, such as the Hammer, Bullish Engulfing, and Morning Star.
- Bearish Patterns: Indicate potential downward movement, such as the Shooting Star, Bearish Engulfing, and Evening Star.
Using Technical Indicators
- Relative Strength Index (RSI)
- Measures the speed and change of price movements. RSI values above 70 indicate overbought conditions, while values below 30 indicate oversold conditions.
- Moving Average Convergence Divergence (MACD)
- Shows the relationship between two moving averages. A bullish signal occurs when the MACD line crosses above the signal line, and a bearish signal occurs when it crosses below.
- Bollinger Bands
- Consists of a middle band (SMA) and two outer bands (standard deviations away from the SMA). They help identify overbought and oversold conditions and potential price reversals.
Integrating PickMyTrade for Enhanced Trading
To take your chart reading and trading to the next level, integrate TradingView with PickMyTrade. PickMyTrade offers seamless automation of your TradingView strategies, connecting directly to Tradovate for efficient trade execution.
- Seamless Integration
- Automate TradingView Strategies: PickMyTrade allows you to automate your TradingView alerts and execute trades directly in Tradovate.
- No Need to Modify Pine Scripts: Use your existing Pine scripts as they are. PickMyTrade reads alerts from webhooks and executes trades based on your predefined conditions.
- Advanced Features
- Support for Strategies and Indicators: PickMyTrade supports both strategies and indicators, providing flexibility and adaptability to your trading style.
- Predefined Take Profit (TP) and Stop Loss (SL): Set predefined TP and SL levels for each trade to manage risk effectively.
- Customizable from Pine Script: Adjust your TP and SL directly within your Pine script for precise control over your trades.
- Affordable and Accessible
- Cost-Effective Plans: Automate your trades for just $50 per month. Experience the benefits of advanced trading automation at an affordable rate.
Conclusion
Reading trading charts is an essential skill that can significantly enhance your trading performance. By understanding the different types of charts, key components, and essential patterns, you can make more informed trading decisions. Moreover, integrating TradingView with PickMyTrade allows you to automate your strategies and achieve seamless trade execution with Tradovate.
Experience the future of trading with PickMyTrade. Visit PickMyTrade today and elevate your trading strategies. For support or more information, contact us at [email protected]. Happy trading!
Hi there! I simply want to give you a big thumbs up for your great information you’ve got here on this post.
I’ll be returning to your web site for more soon.