The Institutional Guide to Strategy Validation and Execution Integrity
Executive Summary
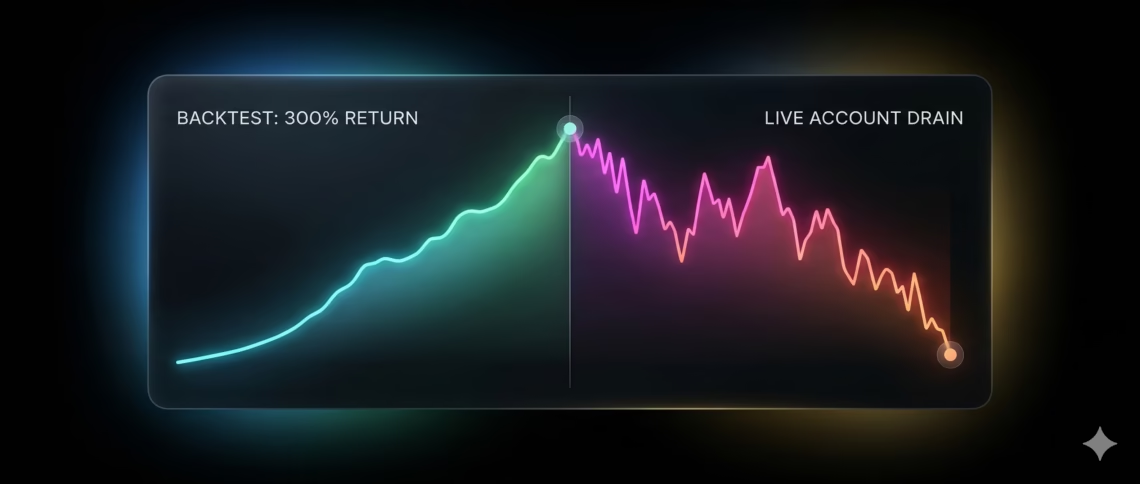
Every algorithmic trader encounters the same haunting experience: a strategy that backtests with triple‑digit returns proceeds to lose money in live markets within weeks. According to a 2025 Stanford study, 58% of retail algorithmic strategies collapse within three months of going live. The primary culprits are backtest overfitting and execution gap—the disconnect between idealized historical simulations and the friction of real‑time trading.
This guide, informed by 15 years of institutional quantitative experience, dissects the anatomy of backtest failure and provides a rigorous framework for validation. Moreover, it introduces a critical missing link: automated execution middleware that ensures your strategy’s signals are translated into trades with sub‑millisecond fidelity, eliminating human latency and emotional interference.
Part I: The Overfitting Trap Why “Perfect” Historical Performance Is Often Illusory
1.1 The Multiple Testing Problem

When a trader tests 50 variations of a moving average crossover, the probability that at least one combination appears profitable by random chance exceeds 92% (assuming a 95% confidence level). This is not a matter of skill but of basic probability:
P(at least one false positive) = 1 − (0.95)^nFor n = 50, this probability is 0.923. Testing many parameters guarantees that some will look excellent purely due to noise.
1.2 Data Snooping and Survivorship Bias
Data snooping occurs when a strategy is repeatedly tweaked until it fits a specific historical dataset. Each adjustment implicitly uses the same data, causing the strategy to memorize past quirks rather than learn genuine market dynamics.
Survivorship bias is equally insidious. Backtesting on indices like the S&P 500 ignores the hundreds of companies that were delisted due to bankruptcy. A strategy that inadvertently buys failing companies will appear profitable in backtest (because those companies vanish) but will accumulate losses in live trading.
Part II: The Hidden Costs Your Backtest Never Shows
2.1 Luck vs. Skill: The Quantopian Verdict
The now‑defunct Quantopian platform ran 888 crowd‑sourced strategies through rigorous out‑of‑sample testing. The correlation between backtested Sharpe ratios and live performance was statistically zero. Strategies that looked exceptional in sample failed systematically when exposed to unseen data.
2.2 The Drawdown Deception
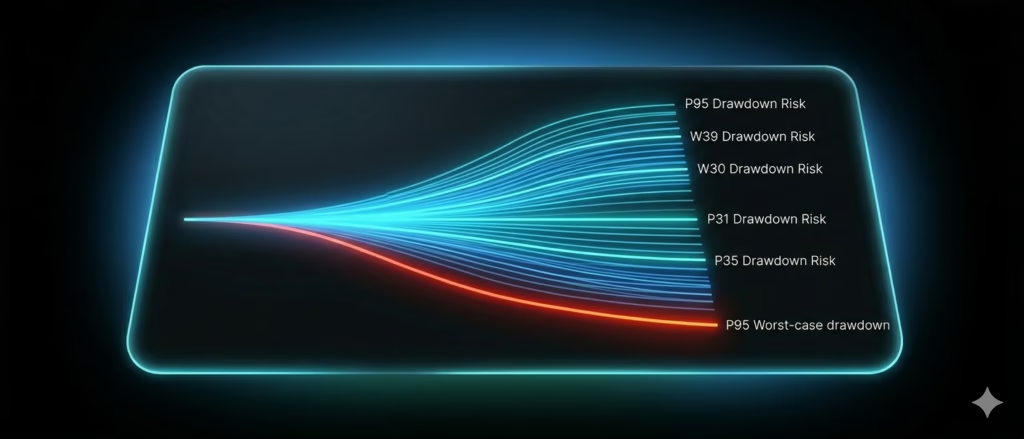
A backtest reports a single trade sequence, but the order of trades in reality is random. Monte Carlo simulation reshuffles your actual trade outcomes thousands of times to reveal the distribution of possible drawdowns:
Backtest max drawdown:          $5,000
Monte Carlo P50 drawdown:       $8,200  (50th percentile)
Monte Carlo P95 drawdown:      $14,800 (95th percentile)
If you sized your account for a $5,000 drawdown, a $15,000 drawdown—which occurs in 5% of sequences—will wipe you out. Institutional traders fund for the P95 drawdown, not the backtest maximum.
2.3 The Execution Fantasy
Backtesting platforms typically assume:
- Orders fill at the exact signal price
- Zero slippage
- Instant execution
- No overnight gaps
Live trading reality imposes:
- Slippage of 0.1–0.5% per trade
- Latency between signal and fill
- Partial fills or rejections during fast markets
- Gaps that blow through stop losses
These frictions can erode 30–50% of a strategy’s theoretical return and if the strategy was marginally profitable to begin with, the erosion turns it negative.
Part III: The 7 Warning Signs of Overfitting
| Warning Sign | Interpretation | Quantitative Red Flag |
|---|---|---|
| Too‑perfect equity curve | Unrealistic smoothness | R² of equity curve > 0.95 |
| Ultra‑specific parameters | Optimal at MA(23) but fails at MA(22) or MA(24) | Performance drop > 50% with ±1 parameter change |
| Performance cliff on new data | Strategy works only on the original sample | Out‑of‑sample return < 30% of in‑sample |
| Excessive parameter testing | Hundreds of combinations tried | More than 50 tests without multiple‑testing correction |
| Market specificity | Works on only one symbol | Sharpe ratio < 0 on any other correlated instrument |
| Fragile timing | Relies on exact entry second | Performance variance > 100% with 1‑second delay |
| Regime dependence | Performance varies wildly by year | Annual returns: +300%, −50%, +150% |
If three or more of these signs are present, the strategy is almost certainly overfit and should not be traded live.
Part IV: The Institutional Validation Framework
Professional quant funds employ a multi‑layer validation process before risking capital. The following seven tests constitute the gold standard.
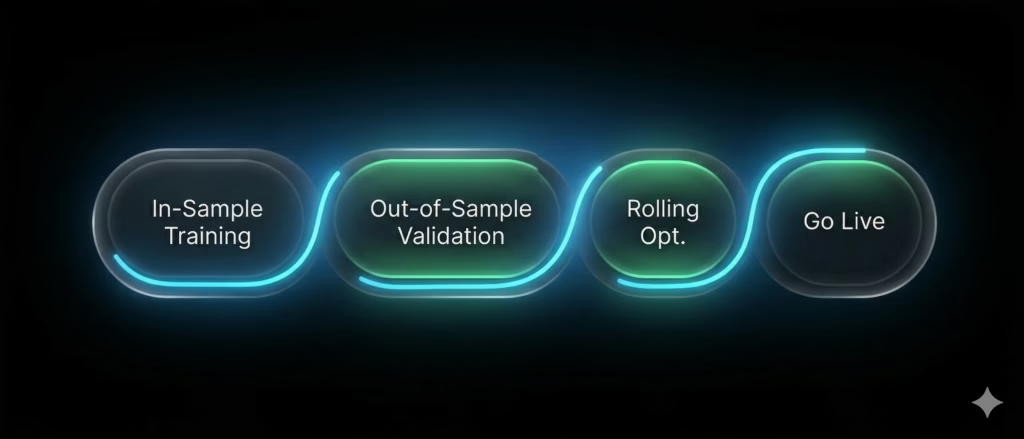
4.1 Walk‑Forward Efficiency (WFE)
Walk‑forward analysis simulates real‑world trading by repeatedly optimizing on a training period and testing on the subsequent out‑of‑sample period.
WFE = (Out‑of‑Sample Return) / (In‑Sample Return)| WFE | Interpretation |
|---|---|
| > 70% | Strong transfer to unseen data |
| 50–70% | Acceptable degradation |
| < 50% | Strategy is overfit |
4.2 Monte Carlo Drawdown Analysis
Generate 10,000 random permutations of trade sequences and compute the 95th percentile drawdown. If the P95 drawdown exceeds 2.5× the backtest drawdown, the strategy’s risk is systematically underestimated.
4.3 Parameter Sensitivity Heatmap
A robust strategy exhibits a wide plateau of profitability across neighboring parameter values. A sharp peak (an “island”) indicates curve‑fitting.
      MA Period
      18  19  20  21  22  23  24  25  26
Ret   +8 +12 +18 +24 +31 +187 +35 +28 +22   ← Cliff edge
A robust strategy instead shows:
Ret +42 +48 +51 +53 +52 +54 +51 +49 +47 ← Profitable plateauThreshold: At least 70% of parameters within ±10% of the optimum should remain profitable.
4.4 Probability of Backtest Overfitting (PBO)
Developed by Dr. Marcos López de Prado (formerly of AQR), PBO measures how often the optimal parameters from one data segment perform worse than the median on another segment.
| PBO | Interpretation |
|---|---|
| < 15% | Low overfitting risk |
| 15–30% | Moderate risk |
| 30–50% | High risk |
| > 50% | Severe overfit—do not trade |
4.5 Deflated Sharpe Ratio
When many strategies or parameters are tested, the maximum observed Sharpe ratio is biased upward. The Deflated Sharpe Ratio corrects for the number of independent trials.
Threshold: Deflated Sharpe > 2.0 indicates a statistically significant edge.
4.6 Out‑of‑Sample Validation
Reserve 20–30% of the data as a final test set that is never touched during development. If the strategy fails on this untouched sample, it is overfit regardless of in‑sample performance.
4.7 The Random Strategy Benchmark
Generate 1,000 random strategies with the same trade frequency and sizing. If your strategy does not outperform 95% of them, it possesses no genuine edge.
Part V: The Execution Gap—Where Strategies Go to Die
Even a perfectly validated strategy can fail in live trading due to execution shortcomings. The gap between signal generation and order placement introduces:
- Latency: Every millisecond delay increases slippage. For a high‑frequency strategy, 100 ms can turn a winner into a loser.
- Emotional interference: Manual execution allows fear and greed to override the algorithm.
- Technical complexity: Managing multiple accounts, adjusting for contract rollovers, and handling partial fills requires sophisticated infrastructure.
Institutional traders close this gap with automated execution middleware. Such platforms receive signals from analysis tools (like TradingView) and route orders directly to brokers with minimal latency, pre‑defined risk rules, and 24/7 reliability.
Part VI: PickMyTrade Institutional‑Grade Execution Automation
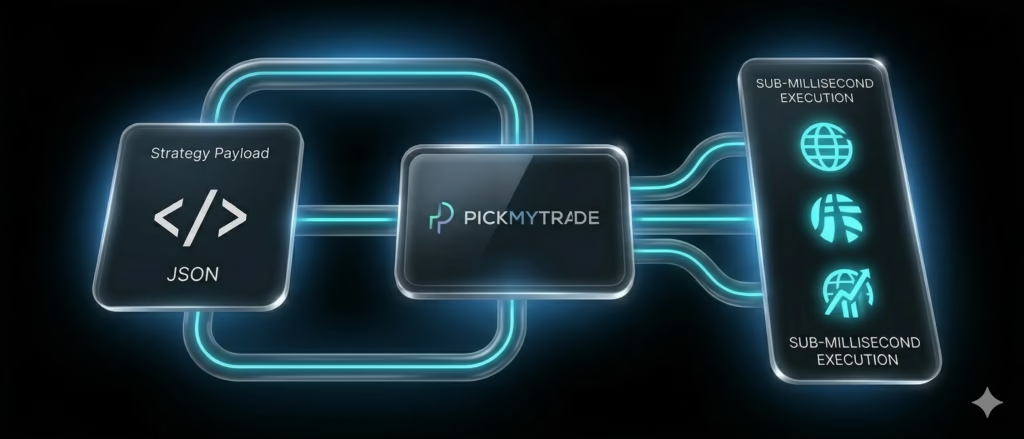
PickMyTrade is a cloud‑based automation platform that bridges TradingView strategies to live brokerage accounts. It eliminates manual intervention, ensures sub‑millisecond execution, and provides advanced order management all without requiring a single line of code.
6.1 How It Works
Step 1: Connect Your Broker
Seamlessly link accounts with Rithmic, Interactive Brokers, TradeStation, TradeLocker, ProjectX, and others.
Step 2: Generate an Alert Payload
From the PickMyTrade dashboard, create a JSON payload that defines the trade parameters. A typical payload looks like this:
{
    "strategy_name": "Momentum Breakout",
    "symbol": "MYM1!",
    "data": "buy",
    "quantity": "{{strategy.market_position_size}}",
    "price": "{{close}}",
    "percentage_tp": 2.06,
    "percentage_sl": 1.96,
    "order_type": "MKT",
    "inst_type": "FUT",
    "platform": "IB",
    "multiple_accounts": [
        {
            "token": "account_token",
            "risk_percentage": 0.5
        }
    ]
}
Step 3: Copy Alert to TradingView
Paste the generated alert message into your TradingView chart’s alert condition.
Step 4: Go Live
Whenever your TradingView condition triggers, the alert is sent to PickMyTrade, which immediately routes the order to your broker—with exact size, stop loss, and take profit.
6.2 Key Capabilities
- Multi‑Account & Multi‑Broker Support: Execute the same signal across dozens of accounts simultaneously, with per‑account risk multipliers.
- Advanced Order Types: Brackets, OCO (one‑cancels‑other), trailing stops, and percentage‑based risk are all configurable directly in the payload.
- Cross‑Symbol Mapping: Alert on ES but trade MES; map any symbol to any broker instrument.
- 24/7 Cloud Operation: No need to keep a personal computer running; the platform executes trades around the clock.
- Unlimited Alerts & Strategies: No caps on the number of signals or trading systems.
6.3 Risk Management Built‑In
Every payload can include hard risk limits: maximum position size, daily loss limits, and drawdown thresholds. These act as a circuit breaker, overriding the strategy if risk parameters are breached.
Part VII: Case Study—From Backtest to Live, Without the Bleed
Background: A systematic trader, “Alex,” developed a mean‑reversion strategy on NQ futures. Backtest (2019–2024) showed 84% annual return with a 1.9 Sharpe. After validating with walk‑forward and Monte Carlo (P95 drawdown 2.1× backtest), Alex was ready to go live.
Challenge: Manual execution caused consistent slippage—entry prices averaged 1.5 ticks worse than signal prices, eroding 22% of the strategy’s edge. Furthermore, Alex could not monitor the market 24 hours a day.
Solution: Alex connected his Interactive Brokers account to PickMyTrade and configured JSON payloads with predefined stops and targets. The strategy now runs fully automated.
Outcome (8 months live):
- Return: 61% (vs. expected 70% after validation)
- Max drawdown: 18% (within P95 projection of 22%)
- Slippage reduced to 0.3 ticks on average
- No missed trades during overnight sessions
Key takeaway: Validation ensured the strategy had a real edge; automation preserved that edge in live execution.
Part VIII: The Complete Pre‑Live Checklist
Before funding a live account, verify both strategy robustness and execution readiness.
| Category | Test | Pass/Fail |
|---|---|---|
| Validation | Walk‑Forward Efficiency > 50% | ☐ |
| Monte Carlo P95 drawdown < 2.5× backtest | ☐ | |
| Parameter sensitivity > 70% profitable | ☐ | |
| PBO score < 30% | ☐ | |
| Deflated Sharpe > 1.5 | ☐ | |
| Out‑of‑sample performance positive | ☐ | |
| Outperforms 95% of random strategies | ☐ | |
| Execution | Broker connectivity tested (paper trading) | ☐ |
| Alert payloads verified with all order types | ☐ | |
| Multi‑account risk settings configured | ☐ | |
| Overnight and weekend coverage confirmed | ☐ | |
| Emergency stop‑loss/circuit breaker active | ☐ |
If any validation test fails, return to development. If any execution test fails, do not go live until resolved.
Conclusion: Evidence, Not Hope
The chasm between backtest brilliance and live trading losses is wide, but it can be bridged with rigorous validation and professional‑grade execution automation. The strategies that survive are not necessarily the ones with the highest backtest returns, but those that:
- Withstand walk‑forward, Monte Carlo, and parameter sensitivity analysis.
- Are traded with an execution infrastructure that eliminates human latency and emotion.
PickMyTrade provides the execution layer that institutional traders have relied on for years—now accessible to any TradingView user. By combining robust strategy development with automated, low‑latency execution, you can finally trade with confidence that your backtest’s promise will translate into real P&L.
Get Started Today
Visit PickMyTrade.io to start your 5‑day free trial. No credit card required. Connect your broker, generate your first alert, and experience institutional‑grade automation.
Trade with evidence. Execute with precision.
PickMyTrade is a registered trademark. All trading involves substantial risk. Past performance is not indicative of future results.
You May also Like:
Understanding CFTC Regulations in Automated Futures Trading
Best Automated Trading Systems for Futures Trading in 2026
TradingView Automated Trading: Ultimate 2026 Guide
Algorithmic Trading Overfitting: Why Backtests Fail in Live Markets