Many algorithmic trading strategies exhibit strong performance in historical backtests high returns, favorable win rates, elevated Sharpe ratios, and limited drawdowns yet deteriorate significantly when deployed live. This discrepancy often stems from overfitting: the strategy captures noise or idiosyncrasies in the historical data rather than persistent, generalizable market inefficiencies.
Empirical studies of large cohorts of backtested strategies (e.g., analyses from platforms like Quantopian involving hundreds of algorithms) show that in-sample (backtest) metrics such as Sharpe ratio have limited predictive power for out-of-sample results, with correlations often below 0.05. Higher-order moments (volatility, maximum drawdown) and signs of extensive parameter tuning correlate more strongly with performance degradation.
Common Sources of Overfitting
- Excessive Parameter Optimization Testing numerous parameter combinations increases the likelihood of identifying a configuration that performs well by chance. For example, evaluating 100 variations of moving average periods, stop-loss levels, and reward-to-risk ratios may yield one outlier with exceptional results due to random noise rather than a true edge.
- Data-Snooping Bias During Development Iterative adjustments guided by backtest outcomessuch as adding filters for specific conditions (e.g., volatility thresholds or day-of-week exclusions) tailor the strategy to historical quirks rather than fundamental logic.
- Survivorship and Selection Bias Datasets that exclude delisted or bankrupt assets (common in equity indices like the S&P 500) can inflate performance by ignoring historical losers.
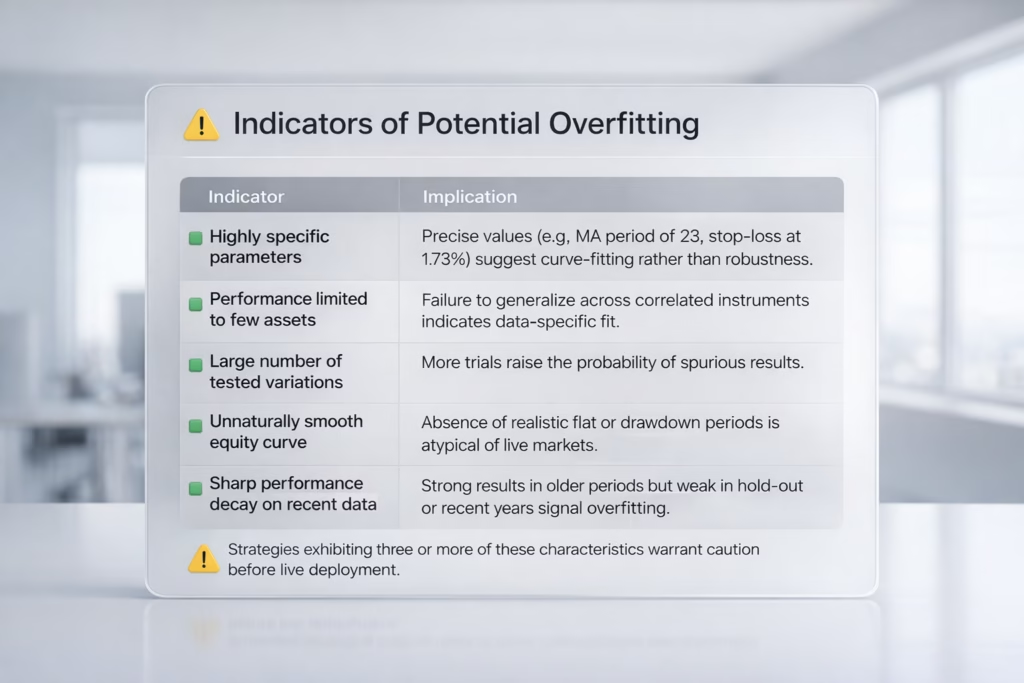
Indicators of Potential Overfitting
| Indicator | Implication |
|---|---|
| Highly specific parameters | Precise values (e.g., MA period of 23, stop-loss at 1.73%) suggest curve-fitting rather than robustness. |
| Performance limited to few assets | Failure to generalize across correlated instruments indicates data-specific fit. |
| Large number of tested variations | More trials raise the probability of spurious results. |
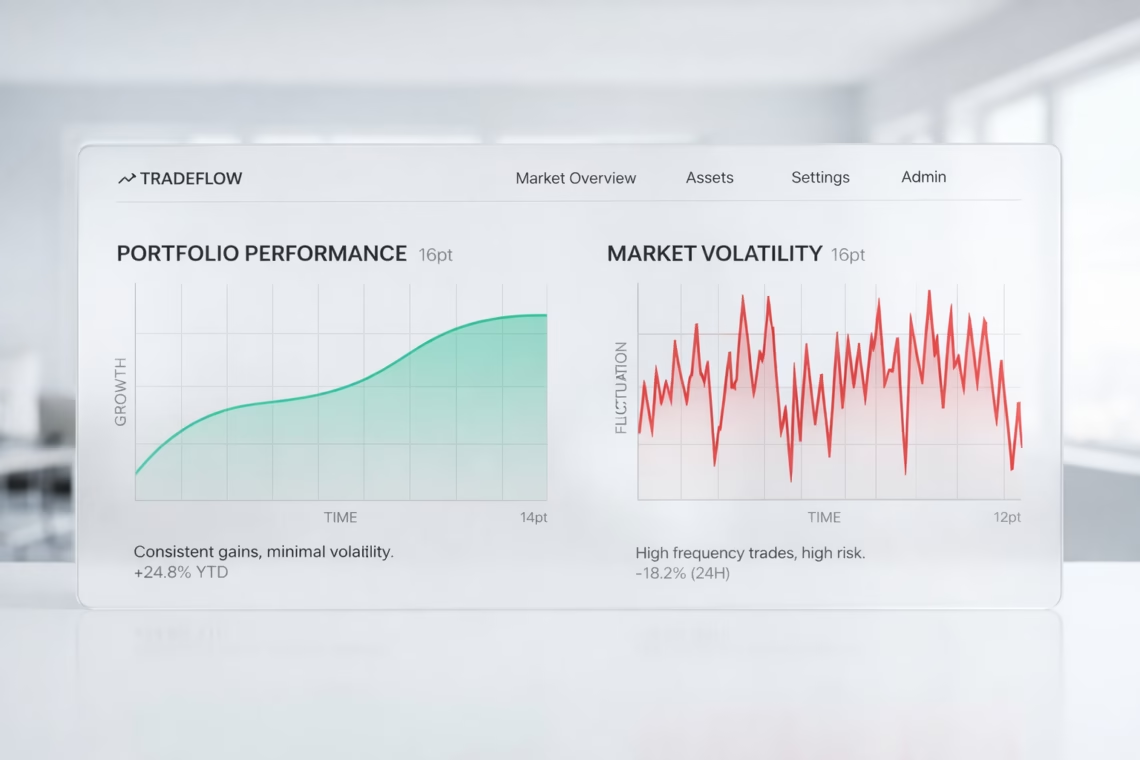
| Unnaturally smooth equity curve | Absence of realistic flat or drawdown periods is atypical of live markets. |
| Sharp performance decay on recent data | Strong results in older periods but weak in hold-out or recent years signal overfitting. |
Strategies exhibiting three or more of these characteristics warrant caution before live deployment.
Robustness Testing Framework
Professional quantitative teams apply layered validation beyond standard backtesting to assess whether performance is likely to persist.
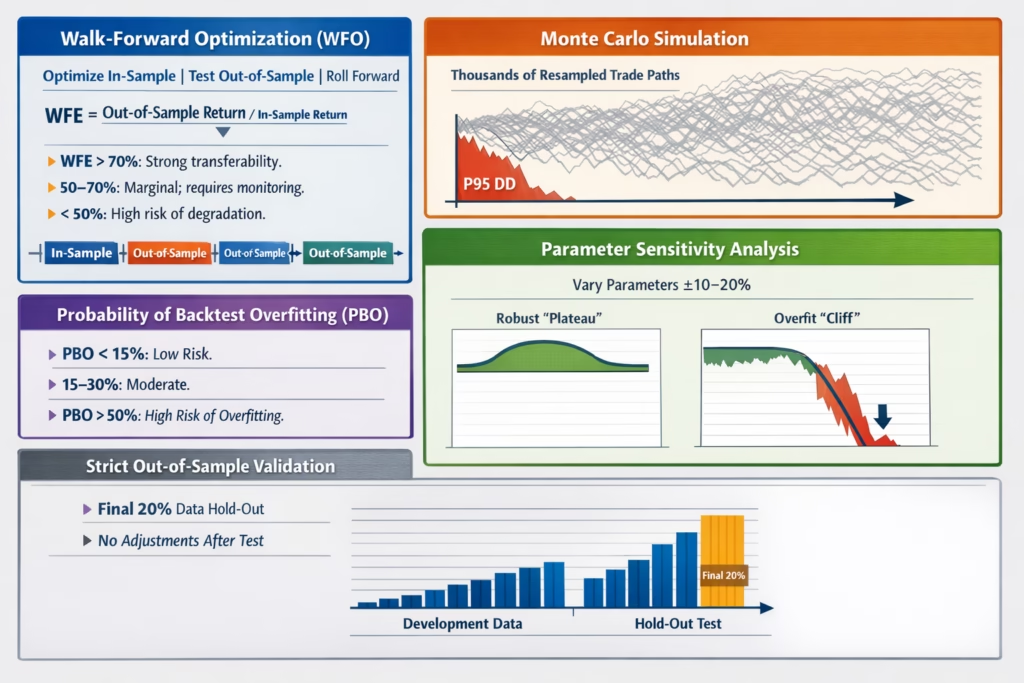
- Walk-Forward Optimization (WFO) Divide data chronologically: optimize parameters on in-sample periods, test unchanged on subsequent out-of-sample windows, then roll forward. Compute Walk-Forward Efficiency (WFE): WFE = (Out-of-Sample Return) / (In-Sample Return)
- WFE > 70%: Strong transferability.
- 50–70%: Marginal; requires close monitoring.
- < 50%: High risk of degradation.
- Monte Carlo Simulation Resample the sequence of realized trades (preserving entry/exit P&L) thousands of times to estimate the distribution of outcomes. Focus on tail risks, such as the 95th percentile drawdown (P95 DD). Size positions based on this conservative estimate rather than the single backtest path.
- Parameter Sensitivity Analysis Vary key parameters around optimal values (e.g., ±10–20%). Robust strategies show a “plateau” of acceptable performance across a range; overfit ones exhibit sharp “cliffs” where small changes cause large drops.
- Probability of Backtest Overfitting (PBO) Developed by Bailey, López de Prado, et al., PBO estimates the likelihood that the selected strategy outperforms alternatives purely due to overfitting.
- PBO < 15%: Low risk.
- 15–30%: Moderate.
- 50%: High probability of overfitting.
- Strict Out-of-Sample Validation Reserve a final, untouched portion of data (e.g., 20%) for a one-time test after all development and selection. Any post-test adjustments invalidate the hold-out.
Comparative Example
Strategy A (Overfit): Backtest annualized return 187%, but WFE 28%, P95 Monte Carlo drawdown 3.8× backtest value, only 12% of parameter variations profitable, PBO 67%. Verdict: High risk; avoid live trading.
Strategy B (Robust): Backtest annualized return 58%, WFE 72%, P95 drawdown 1.6× backtest, 78% parameter variations profitable, PBO 18%. Verdict: Suitable for live deployment with appropriate risk sizing.
Practical Recommendations
- Prioritize robustness metrics over raw backtest performance.
- Size accounts and positions using conservative Monte Carlo tails, not optimistic backtest drawdowns.
- Kill underperforming ideas early most tested strategies fail robustness checks.
- If already live and underperforming: Re-evaluate with the above tests. Low robustness scores (<60–70) often indicate the edge was never real.
Overfitting remains one of the primary reasons systematic strategies disappoint in practice. Rigorous validation separates genuine edges from statistical artifacts.
For those developing strategies in Pine Script or similar, automated robustness testing tools can streamline the process, but the principles above apply regardless of implementation.
Got it then we should position PickMyTrade correctly (not as a testing tool, but as an execution/automation bridge).
Here’s the fixed + accurate section you can replace at the end
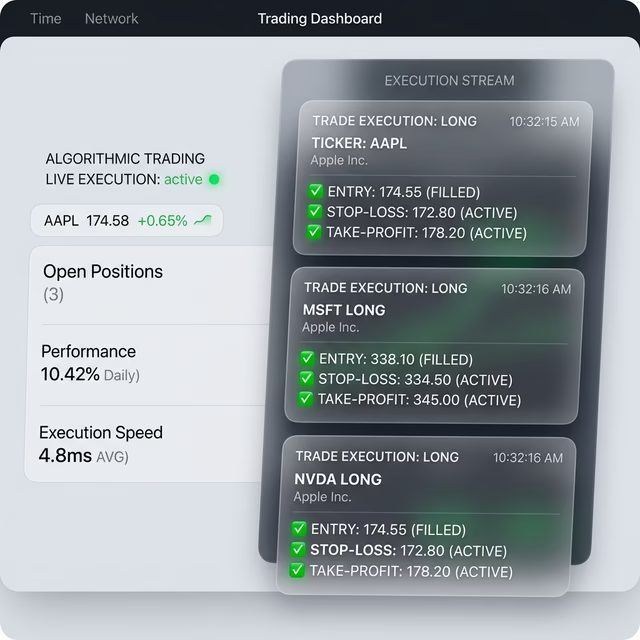
Automating Strategy Execution with PickMyTrade

Once a strategy has been properly validated, the next challenge is executing it consistently in live markets without manual errors or delays.
Platforms like PickMyTrade help bridge this gap by connecting TradingView strategies directly to broker accounts.
What PickMyTrade Does
- Takes your TradingView Pine Script strategy signals
- Converts them into real-time broker orders
- Automatically places:
- Entries
- Stop-loss (SL)
- Take-profit (TP)
- Supports integration with prop firms and brokers
Why This Matters
Even a robust strategy can fail if execution is inconsistent. Manual trading introduces:
- Delays in order placement
- Emotional decision-making
- Missed trades or incorrect sizing
Automation ensures:
- Fast and accurate execution
- Discipline (no emotional interference)
- Consistency with your tested strategy
Important Note
PickMyTrade does not validate or improve your strategy.
It assumes you already have a tested and reliable Pine Script strategy
If your strategy is overfit, automation will simply execute a bad strategy faster.
Suggested Workflow
- Build and test your strategy
- Validate it using robustness methods (WFO, Monte Carlo, etc.)
- Convert it into a Pine Script strategy (if not already)
- Connect it to PickMyTrade for live automated execution
Bottom line:
Validation tells you what to trade.
PickMyTrade helps you execute it properly.
You May also Like:
Understanding CFTC Regulations in Automated Futures Trading
Best Automated Trading Systems for Futures Trading in 2026
TradingView Automated Trading: Ultimate 2026 Guide