Welcome to a comprehensive guide on a powerful trading strategy that effectively combines three key indicators: VWAP (Volume Weighted Average Price), MACD (Moving Average Convergence Divergence), and Super Trend. This strategy is designed to help you identify clear buy and sell signals, making your trading decisions more informed and potentially more profitable.
Understanding the Key Indicators
Before diving into the strategy, it’s essential to understand what each of these indicators does and how they can be used together effectively.
1. What is VWAP?
VWAP stands for Volume Weighted Average Price. It provides traders with the average price at which a security has traded throughout the day, based on both price and volume. When the price is above the VWAP, it indicates that the market is experiencing buying pressure, while a price below the VWAP suggests selling pressure. This makes VWAP a crucial indicator for gauging market strength or weakness.

2. What is Super Trend?
The Super Trend indicator is used to determine the current trend’s direction. It provides buy and sell signals through arrows on the chart. A green arrow indicates an uptrend, while a red arrow signals a downtrend. This indicator helps traders identify the overall market trend quickly.

3. What is MACD?
MACD is a momentum indicator that helps traders see changes in the strength, direction, momentum, and duration of a trend. It consists of two lines: the MACD line and the signal line. A crossover occurs when these two lines intersect, indicating potential momentum shifts. A crossover of the MACD line above the signal line suggests bullish momentum, while a crossover below indicates bearish momentum.

Setting Up the Indicators on TradingView
For those using TradingView, setting up these indicators is straightforward. However, if you are using the free version, you can only add two indicators. Here’s how to add all three:
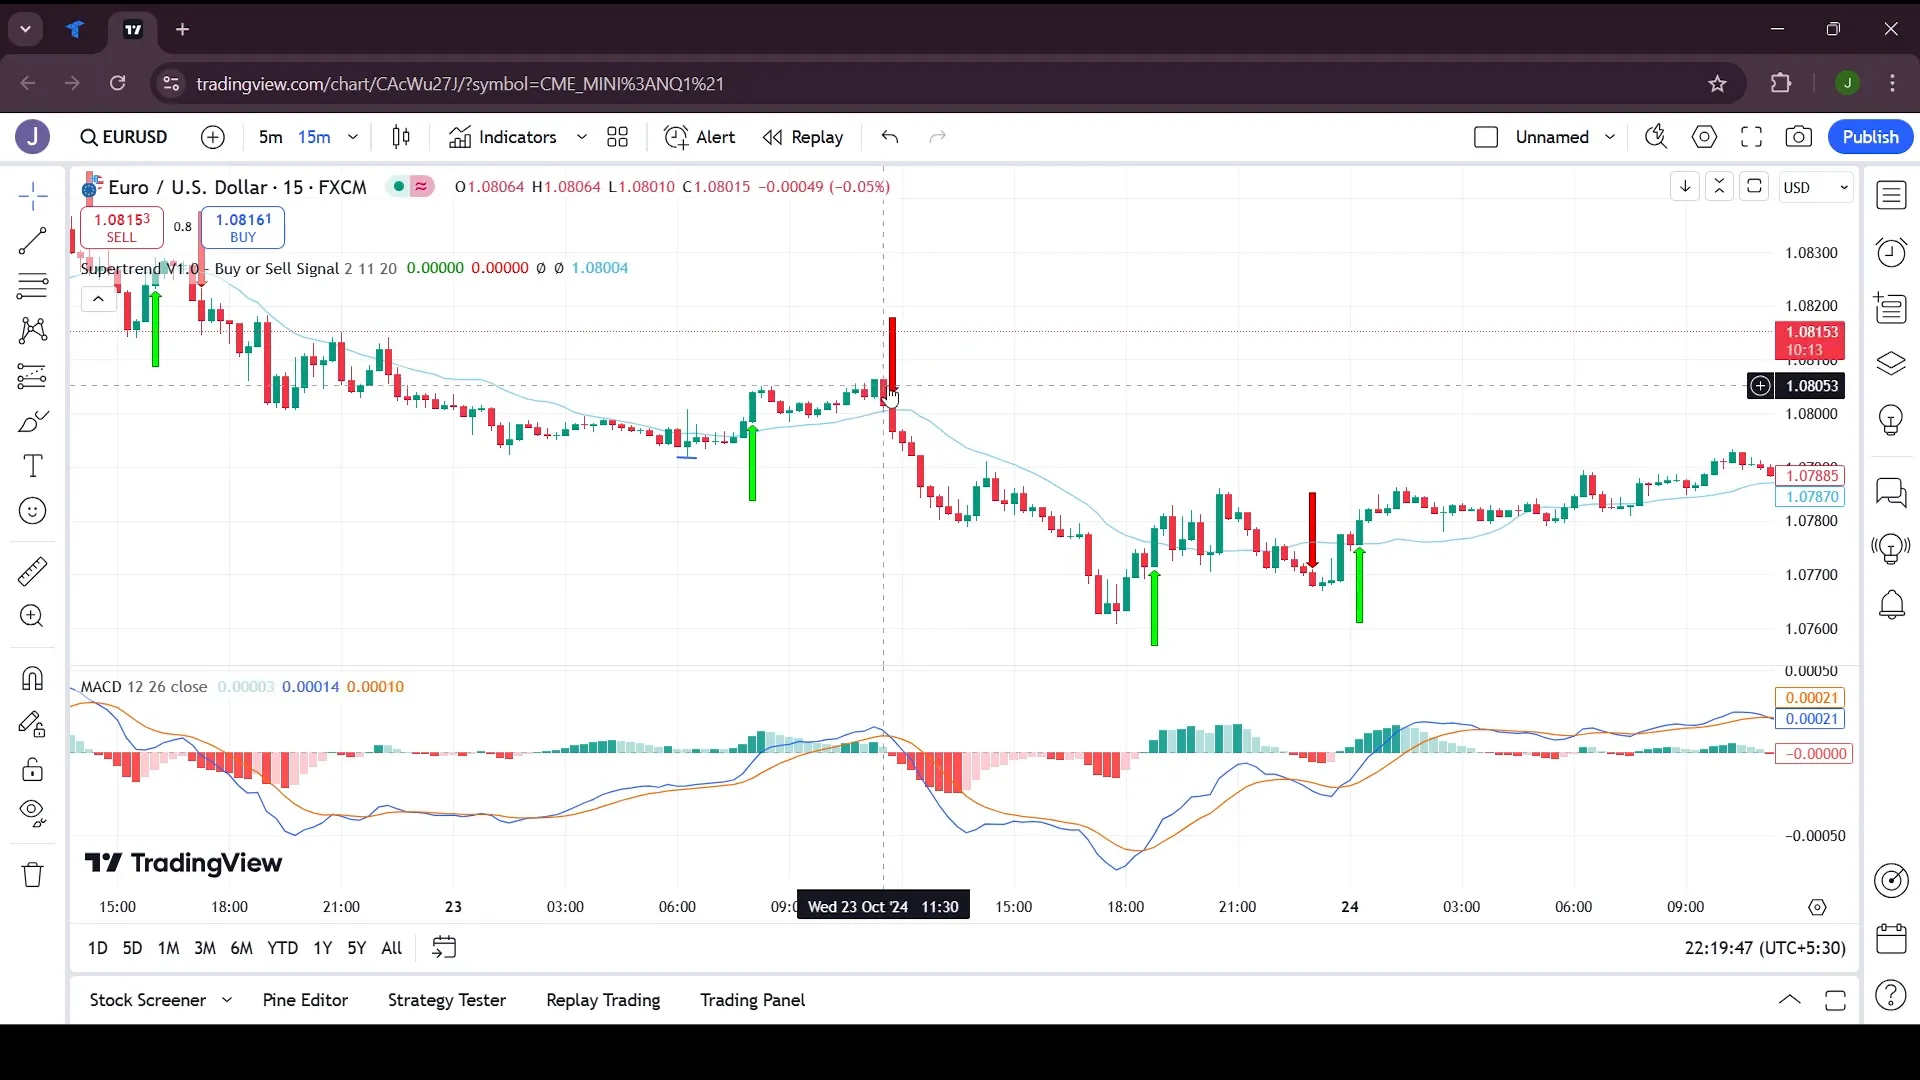
- Search for the Super Trend indicator and add it to your chart. Adjust the period to 20 and the factor to 2.
- Search for the VWAP indicator and add it as well.
- Finally, add the MACD indicator to your chart.
How the Strategy Works
Now that we have set up the indicators, let’s explore how to use them together for trading signals.
Identifying Sell Signals
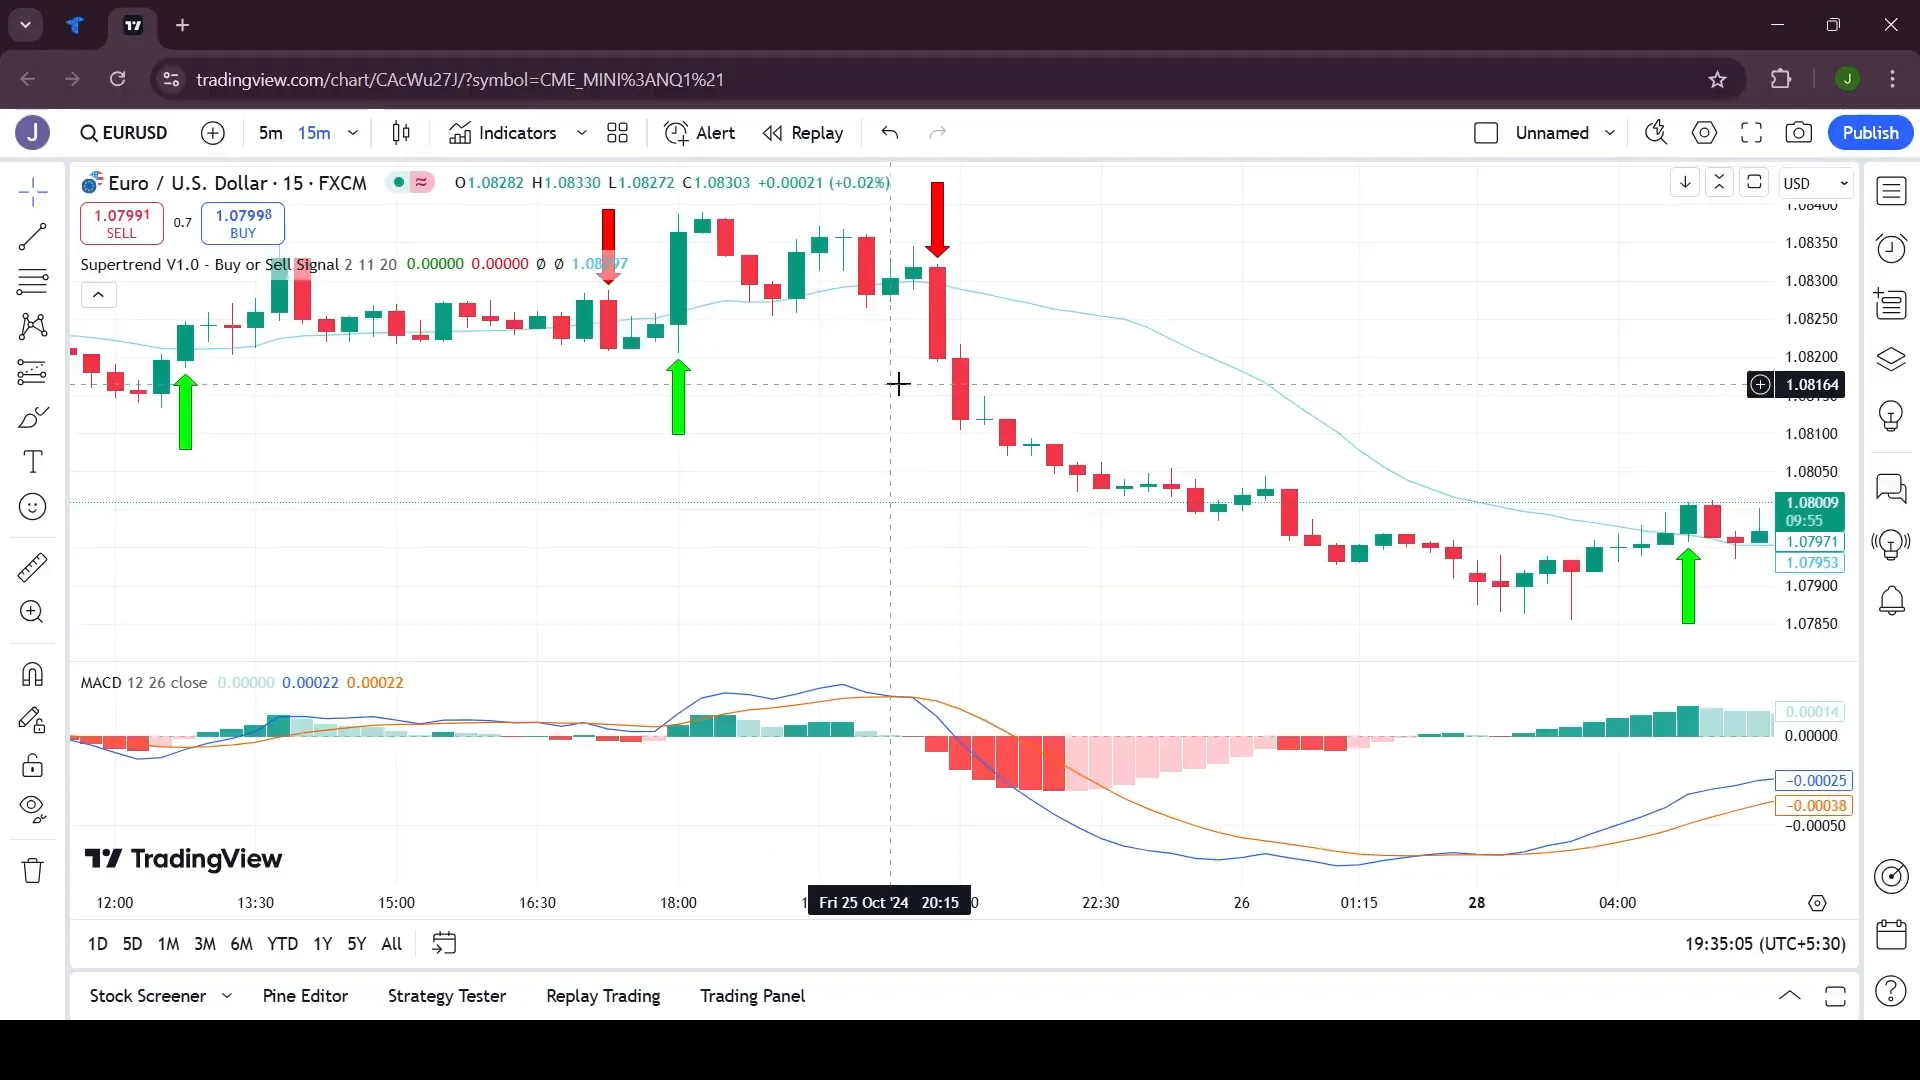
To identify a sell signal, look for the following conditions:
- The Super Trend indicator shows a red arrow (indicating a downtrend).
- The price should be touching or crossing below the VWAP line.
- The MACD line should cross below the signal line.
When all these conditions align, it’s a strong signal to enter a put position. Set your stop loss at the wick of the previous candle to manage your risk effectively.
Identifying Buy Signals
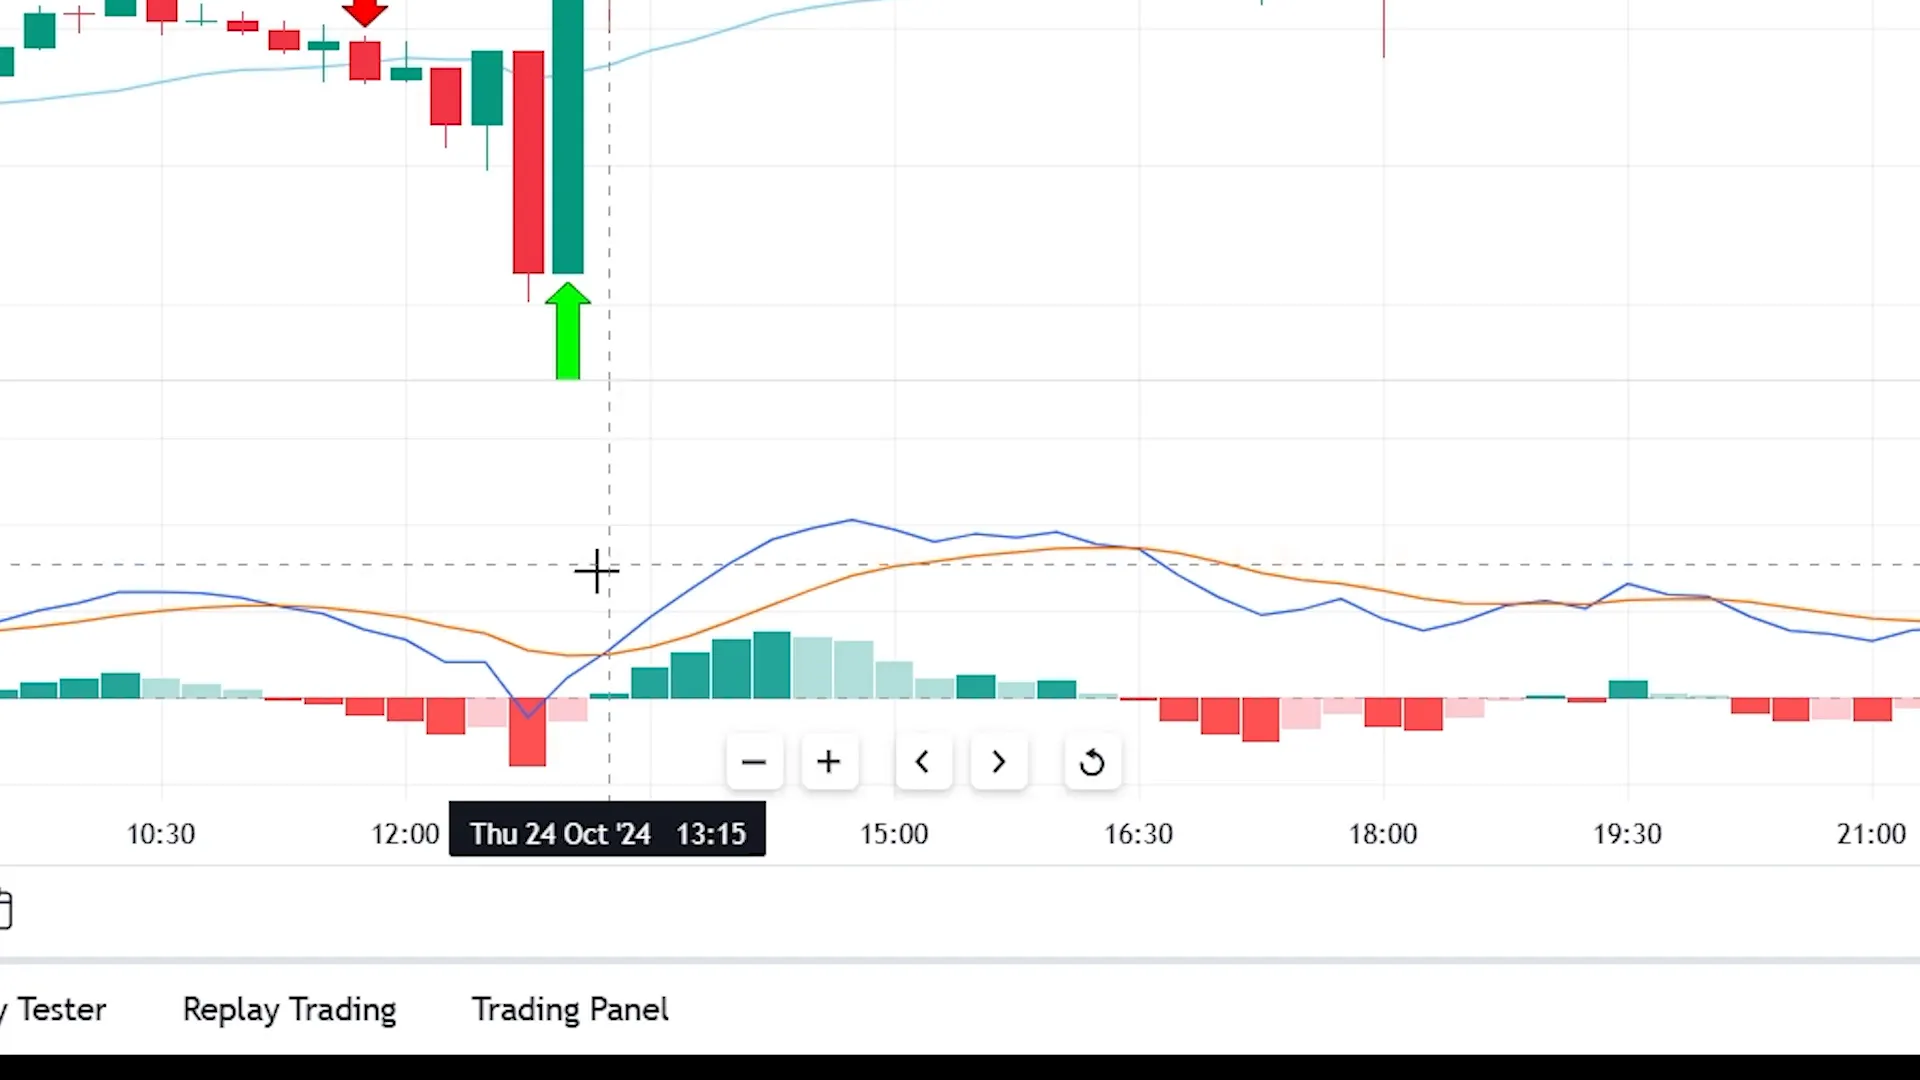
Conversely, for a buy signal, look for:
- The Super Trend indicator shows a green arrow (indicating an uptrend).
- The price should be touching or crossing above the VWAP line.
- The MACD line should cross above the signal line.
If these conditions are met, consider entering a long position, again placing your stop loss at the wick of the previous candle.
Why This Strategy Works
This strategy is effective because it combines different perspectives:
- VWAP provides an average price based on real volume, giving a more accurate picture of market dynamics.
- Super Trend indicates the market direction, helping traders align their trades with the prevailing trend.
- MACD offers insights into momentum, indicating when trends may be strengthening or weakening.
When these indicators align, it creates a stronger signal for traders, increasing the likelihood of success.
Risks and Tips
Like any trading strategy, this one is not foolproof. Here are some tips to enhance your trading:
- Be cautious in choppy or highly volatile markets, as they can generate false signals.
- Consider testing different settings for each indicator to see what works best for your trading style.
- Incorporate risk management practices, such as setting stop losses and determining appropriate position sizes based on your risk tolerance.
Final Thoughts
This trading strategy using VWAP, MACD, and Super Trend provides a simple yet effective way to identify trading opportunities. By combining these indicators, traders can gain clearer insights into market trends and momentum. Remember to practice risk management and continuously refine your strategy as you gain more experience in trading.
For more information and automation options, check out PickMyTrade’s automated trading solutions.
Thanks for reading, and happy trading!
PickMyTrade
PickMyTrade specializes in automating trading bots, enabling seamless strategy execution for futures from platforms like TradingView, across well-known brokers such as Tradovate.


any promo going on lately beside 5 days
We have PRODUCTHUNT10 for 10% discount on any subscription
When some one searches for his necessary thing, therefore he/she wishes to be available that in detail, thus that thing is maintained over here.
Feel free to surf to my website; world symbol copy and paste
Every sentence feels like a carefully chosen stone on a path of wisdom — sturdy, beautiful, and meaningful.