If you’ve ever wanted to convert a TradingView indicator to a strategy, you know how tricky Pine Script can feel. Indicators are great for signals, but strategies unlock backtesting, optimization, and automation. In this guide, we’ll show you exactly how to transform your favorite indicator into a backtestable TradingView strategy using AI.
Why this matters (quick)
Indicators are visual. Strategies are testable and automatable. Converting an indicator into a strategy lets you:
- quantify edge (net profit, drawdown, win rate),
- parameterize & optimize,
- run robust walk-forward tests,
- and automate execution safely.
Concrete workflow — step by step (with details)
- Pick your indicator on TradingView
- Add it to your chart and open the Source Code (hover → Source code).
- Copy the entire indicator script (Pine Script v4 or v5).
- Decide the exact rules you want
- Be explicit. Example: “Buy when ema(8) crosses above ema(21) on candle close. Exit when ema(8) crosses below ema(21).”
- Write any extra constraints (e.g., only trade above 200 EMA, only trade between 08:00–16:00, or minimum ATR size).
- Use an AI prompt (paste code + instructions)
- Use the AI to convert the indicator code into a Pine Script v5 strategy.
- I include a robust prompt template below — paste your indicator code into it.
- Create a working copy in TradingView
- TradingView → Create →
New script→ clear it → paste the AI output → Save → Add to chart. - Open Strategy Tester.
- TradingView → Create →
- Visual check
- Confirm buys/sells align with the indicator signals on the chart (look at entry arrows).
- If entries happen mid-candle or at wrong times, require the AI to use candle-close logic (see prompt).
- Iterate
- If the AI got conditions wrong, correct it by specifying the exact logic or give an error message + line number and ask it to fix the code.
- Add risk management & exits
- Add stop loss, take profit, position sizing (percent of equity or fixed quantity). Example code snippets below.
- Test & optimize
- Use parameter sweeps, in-sample/out-of-sample (walk-forward), and robust metrics (Sharpe-like ratios, max drawdown, net profit, trade count).
Ready-to-use AI prompt template
Copy this entire block, paste into your AI chat, then paste your indicator code at the bottom where indicated.
You are a professional Pine Script v5 developer and TradingView strategist.
Task: convert the following *indicator script* into a fully working *strategy* compatible with Pine Script v5.

Requirements:
1. Output only working Pine Script v5 code (no explanation). Use `strategy()` not `indicator()`.
2. Use candle-close logic: only trigger entries/exits when the candle closes (use `barstate.isconfirmed` where needed).
3. Provide clear inputs for parameters (lengths, stop loss %, take profit %, risk %).
4. Implement entries/exits exactly as described in the “Trading rules” section below.
5. Add optional `showSignals` input to plot entry/exit arrows and markers.
6. Add comments where you add stop loss/take profit/exits.
7. If there are errors, I will paste the exact compilation error and the line number; then fix it.
8. Keep default position sizing simple (1 contract); I can change sizing later.

Trading rules:
- BUY when:  <<REPLACE WITH YOUR RULE (e.g., "when faster EMA crosses over slower EMA")>>
- SELL (exit long) when: <<REPLACE WITH YOUR RULE (e.g., "when faster EMA crosses under slower EMA")>>
- (Optional) Short rules: <<if you want shorts, define here>>
- Only act on candle close.

Indicator code:
<<PASTE YOUR INDICATOR PINE SCRIPT HERE>>
Notes: replace the placeholders (BUY/SELL rules) with the logic you want. If AI responds with errors or inverted logic, tell the AI explicitly: “It buys when it should sell — please invert the buy/sell logic” or paste the compiler error + line number.
Three practical Pine Script v5 strategy templates
Below are starting templates you can paste into TradingView. They are intentionally simple, robust, and use barstate.isconfirmed to act on candle close. Use them as base templates — tweak inputs, add risk sizing, optimization ranges.
Important: these templates are educational and should be tested on paper/backtest before any live use.
1) EMA crossover strategy (example)
//@version=5
strategy("EMA Crossover Strategy (AI Template)", overlay=true, default_qty_type=strategy.percent_of_equity, default_qty_value=1)

// Inputs
fastLen = input.int(8, "Fast EMA")
slowLen = input.int(21, "Slow EMA")
useShort = input.bool(false, "Allow shorts")
showSignals = input.bool(true, "Plot entry/exit markers")

// EMAs
fast = ta.ema(close, fastLen)
slow = ta.ema(close, slowLen)
plot(fast, title="Fast EMA")
plot(slow, title="Slow EMA")

// Signals (act on candle close)
longSignal  = ta.crossover(fast, slow) and barstate.isconfirmed
longExit    = ta.crossunder(fast, slow) and barstate.isconfirmed
shortSignal = ta.crossunder(fast, slow) and barstate.isconfirmed
shortExit   = ta.crossover(fast, slow) and barstate.isconfirmed

// Entries & exits
if (longSignal)
    strategy.entry("Long", strategy.long)

if (longExit)
    strategy.close("Long")

if (useShort)
    if (shortSignal)
        strategy.entry("Short", strategy.short)
    if (shortExit)
        strategy.close("Short")

// Optional plots for signals
plotshape(showSignals and longSignal, title="LongEntry", location=location.belowbar, style=shape.triangleup, size=size.tiny, text="BUY")
plotshape(showSignals and longExit,  title="LongExit",  location=location.abovebar, style=shape.triangledown, size=size.tiny, text="SELL")
2) Bollinger Bands strategy (price outside bands -> trade)
//@version=5
strategy("Bollinger Bands Strategy (AI Template)", overlay=true, default_qty_type=strategy.percent_of_equity, default_qty_value=1)

// Inputs
len = input.int(20, "BB Length")
mult = input.float(2.0, "StdDev Mult")
tpPct = input.float(4.0, "Take Profit %", step=0.1)
slPct = input.float(2.0, "Stop Loss %", step=0.1)
showSignals = input.bool(true, "Show signals")

// Bands
basis = ta.sma(close, len)
dev = mult * ta.stdev(close, len)
upper = basis + dev
lower = basis - dev
plot(basis, title="Basis")
plot(upper, title="Upper")
plot(lower, title="Lower")

// Rules: buy when close > upper; exit when close < lower (act on candle close)
longSignal = close > upper and barstate.isconfirmed
longExit   = close < lower and barstate.isconfirmed

if (longSignal)
    // enter long and place TP/SL on next candle using strategy.exit
    strategy.entry("Long", strategy.long)
    entryPrice = close
    strategy.exit("Exit Long", from_entry="Long", stop=entryPrice * (1 - slPct/100), limit=entryPrice * (1 + tpPct/100))

if (longExit)
    strategy.close("Long")

plotshape(showSignals and longSignal, location=location.belowbar, style=shape.triangleup, text="BUY")
plotshape(showSignals and longExit,  location=location.abovebar, style=shape.triangledown, text="SELL")
3) SuperTrend-style trend strategy (color->trade)
This example uses a simple ATR-based supertrend formula.
//@version=5
strategy("SuperTrend Strategy (AI Template)", overlay=true, default_qty_type=strategy.percent_of_equity, default_qty_value=1)

// Inputs
atrLen = input.int(10, "ATR Length")
factor = input.float(3.0, "Factor")
showSignals = input.bool(true)

// Calculate SuperTrend (simplified)
atr = ta.atr(atrLen)
hl2 = (high + low) / 2
var float up = na
var float down = na
var int trend = 1  // 1 = up, -1 = down

upperBasic = hl2 + factor * atr
lowerBasic = hl2 - factor * atr

if na(up)
    up := upperBasic
    down := lowerBasic

up := math.min(upperBasic, up[1])
down := math.max(lowerBasic, down[1])

if close > down[1]
    trend := 1
else if close < up[1]
    trend := -1

plotshape(showSignals and trend == 1 and trend[1] == -1, title="LongEntry", location=location.belowbar, style=shape.triangleup, text="BUY")
plotshape(showSignals and trend == -1 and trend[1] == 1, title="ShortEntry", location=location.abovebar, style=shape.triangledown, text="SELL")

// Trading rules: buy when trend turns up; exit when trend turns down
if (trend == 1 and trend[1] == -1 and barstate.isconfirmed)
    strategy.entry("Long", strategy.long)

if (trend == -1 and trend[1] == 1 and barstate.isconfirmed)
    strategy.entry("Short", strategy.short)

// Optional: close on opposite signal
if (trend == -1 and strategy.position_size > 0)
    strategy.close("Long")
if (trend == 1 and strategy.position_size < 0)
    strategy.close("Short")
How to add stop loss / take profit reliably
- Use
strategy.exit()to attach stop/limit to a given entry name. - Compute stop/target as
entryPrice * (1 ± pct/100)at the time of entry (storecloseinto a variable when you callstrategy.entry()). - Test edge cases: low-liquidity symbols, tick size rounding, broker commission.
Example pattern (conceptual):
if (enterSignal)
    strategy.entry("Long", strategy.long)
    entryPrice := close
    strategy.exit("ExitLong", from_entry="Long", stop=entryPrice*(1 - sl/100), limit=entryPrice*(1 + tp/100))
If you see rounding or “invalid order” errors, adjust stop/limit by a small epsilon (like syminfo.mintick * 1).
Troubleshooting common problems (and exact phrasing to use with AI)
- AI inverted logic (buys when should sell)
Tell the AI: “Your logic is inverted: it enters long on a bearish condition. Swap the buy/sell conditions so that X = buy and Y = sell. Keep all other code intact.” - Entries happen mid-candle
Tell the AI: “Only act on candle close — wrap entry/exit conditions withbarstate.isconfirmedor useta.crossoverwithbarstate.isconfirmed.” - Compilation error with line number
Paste the compiler error exactly and say: “There is error on line N: [error]. Please fix the code and output corrected Pine Script v5 only.” - Staircase gap plots / visual artifacts
- In TradingView, the “Fill gaps” chart option helps visually.
- Also test on the same timeframe as the indicator or ensure
request.security()calls use the samegapssettings if you use multi-timeframe data.
- Strategy produces few trades / too many trades
- Add filters: minimum ATR, higher timeframe confirmation, volume filter, or runway above a trend filter (200 EMA).
- Increase timeframe or add trade cooldown (e.g.,
bar_index - lastEntryBar > X).
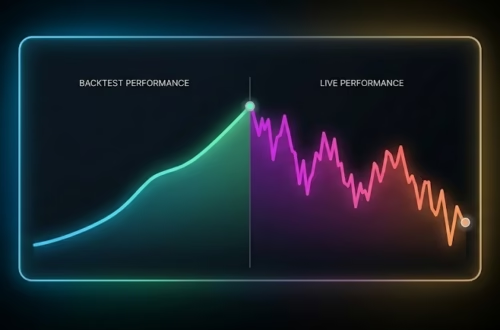
Testing & optimization plan (actionable)
- Baseline test — run strategy on multiple timeframes: 1D, 4H, 1H.
- In-sample / out-of-sample split — e.g., train on 2018–2021, test on 2022–present.
- Parameter sweep — grid-search sensible ranges (EMA: 5–50, BB length 10–40, ATR factor 1.5–4). Keep ranges small at first.
- Walk-forward — re-optimize parameters on rolling windows and test forward.
- Stability metrics — net profit, max drawdown, profit factor, avg trade, trades per year. Prefer stable metrics across assets/periods.
- Sensitivity analysis — see which parameters the strategy performance is most sensitive to.
Risk management checklist (must-have before automating)
- Set a max drawdown threshold that disables trading if exceeded (stop trading if drawdown > X%).
- Limit per-trade risk to a small percent of equity (1–2%).
- Add maximum open positions.
- Test slippage & commissions (TradingView simulator supports commission input).
- Implement a kill-switch accessible remotely.
Publishing & SEO tips (to maximize value of this blog)
- Use the human-readable title: Convert TradingView Indicators into Backtestable Strategies with AI — Step-by-Step
- Add screenshots: indicator on chart, strategy tester summary, equity curve.
- Include code blocks (the templates above) and a downloadable
.pinefile for each template. - Add a short video embed + transcript (already included).
- Add a downloadable prompt text file (the AI prompt template) — flows readers can copy/paste.
- Use internal links to other guides: “How to backtest in TradingView”, “Walk-forward testing explained”, etc.
Automate Your Trading with PickMyTrade
For traders looking to automate trading strategies, PickMyTrade offers seamless integrations with multiple platforms. You can connect Rithmic, Interactive Brokers, TradeStation, TradeLocker, or ProjectX through pickmytrade.io.
If your focus is Tradovate automation, use pickmytrade.trade for a dedicated, fully integrated experience. These integrations allow traders to execute strategies automatically, manage risk efficiently, and monitor trades with minimal manual intervention.


Love the emphasis on using AI for converting indicators into strategies! The ability to backtest and automate is a game-changer. Has anyone tried automating their strategies on live markets? Curious to hear about the real-world results.