
This walkthrough follows a historical TradingView Strategy Tester simulation for a trailing take-profit strategy. The figures report simulated trades in the selected symbol and time frame. They do not measure funded-account performance.
Table of Contents
- Table of Contents
- Exploring the Best Trailing Take Profit Strategy
- Understanding the Strategy
- Applying Strategies to Crude Oil Trading
- Exploring Various Time Frames
- Testing Different Time Frames
- Creating Alerts for Automation
- Replaying Signals to Validate Strategies
- Steps to Replay and Validate
- Evaluating Returns for Different Symbols
- Key Considerations for Symbol Evaluation
- Comparing Results Across Various Futures
- Optimising Strategy for Futures
- Conclusion and Next Steps
- Frequently Asked Questions
- What is the primary advantage of using a trailing take profit strategy?
- How can I ensure my strategy does not repaint?
- What should I consider when applying this strategy to different symbols?
- PickMyTrade
Table of Contents
- Exploring the Best Trailing Take Profit Strategy
- Replaying Signals to Validate Strategies
- Evaluating Returns for Different Symbols
- Comparing Results Across Various Futures
- Conclusion and Next Steps
- Frequently Asked Questions
Exploring the Best Trailing Take Profit Strategy
The concept of a trailing take profit strategy offers a unique twist to the conventional trailing stop-loss. Unlike the traditional method where the focus is solely on limiting losses, this strategy emphasises maximising profits by trailing the take profit level as the market moves favourably.
Understanding the Strategy
Developed by a trader named Devat, this strategy leverages the concept of dynamically adjusting the take profit points based on market movements. The idea is to lock in profits while still allowing room for further gains. This method can be particularly effective in volatile markets where price swings can be significant.
Applying Strategies to Crude Oil Trading
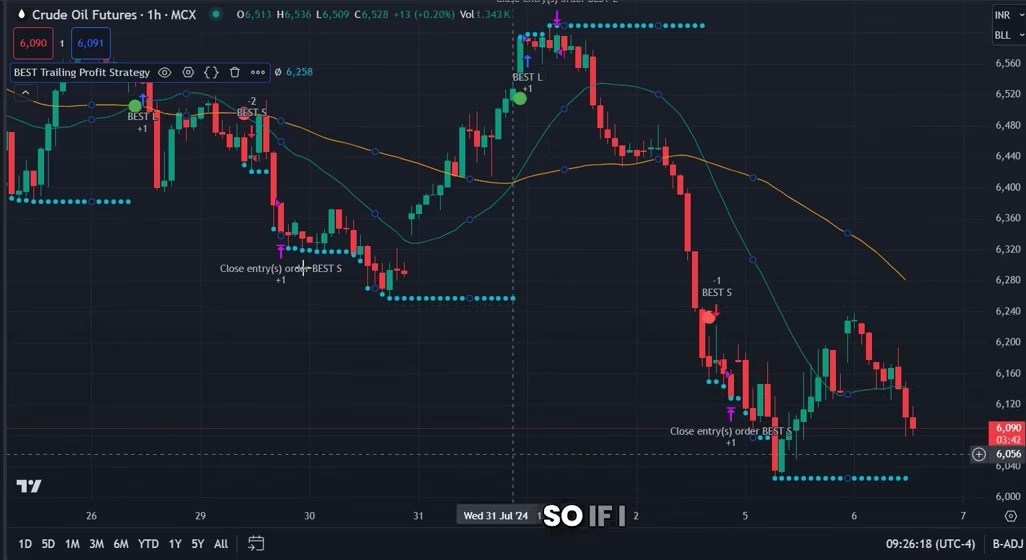
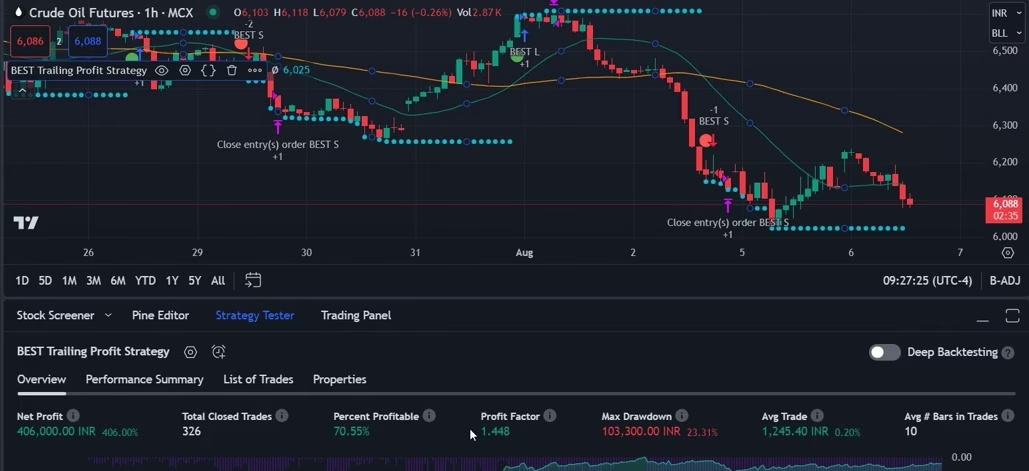
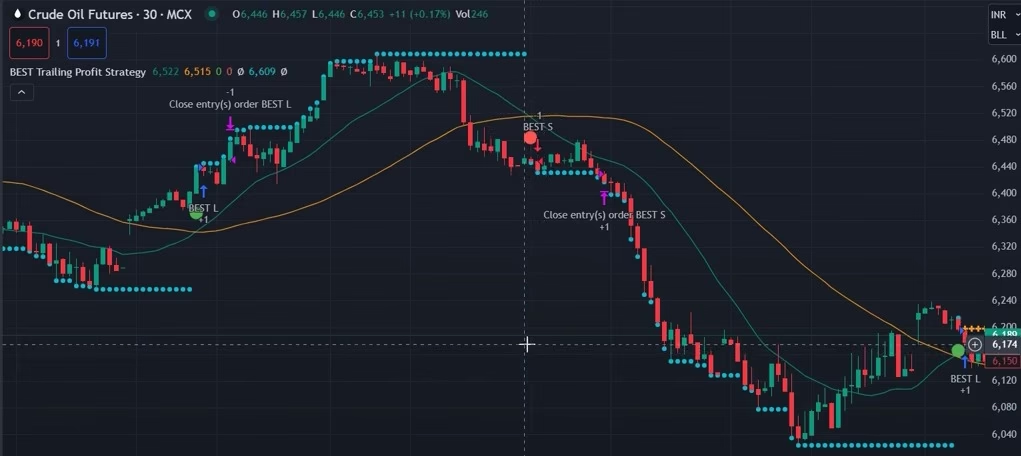
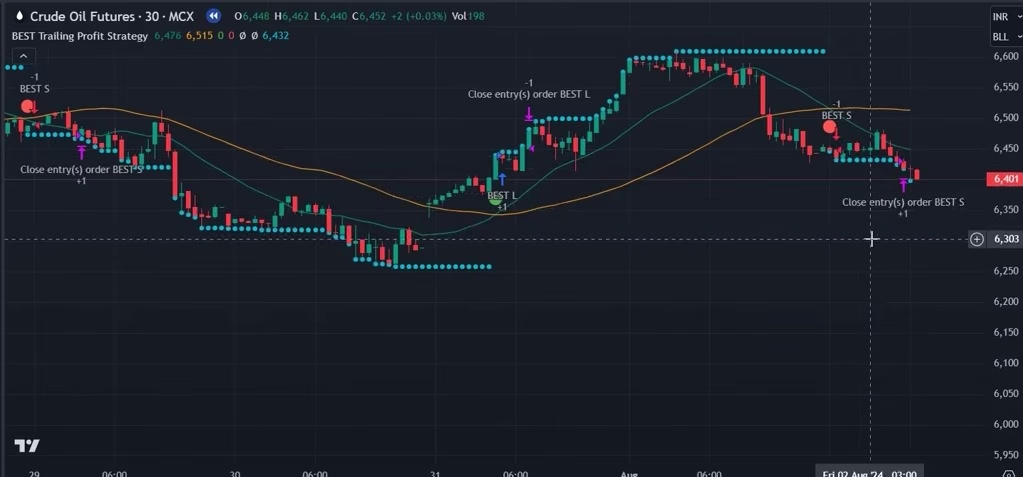
The presenter tests one crude-oil futures contract on a one-hour chart, then switches to a 30-minute chart. Compare the net profit, maximum drawdown and number of closed trades within each run.
By adjusting the take profit trigger according to the specific trading symbol, such as crude oil, traders can tailor the strategy to suit their needs. The key is to find a balance between risk and reward, ensuring that the trigger value aligns with the trader’s risk tolerance and market conditions.
Exploring Various Time Frames
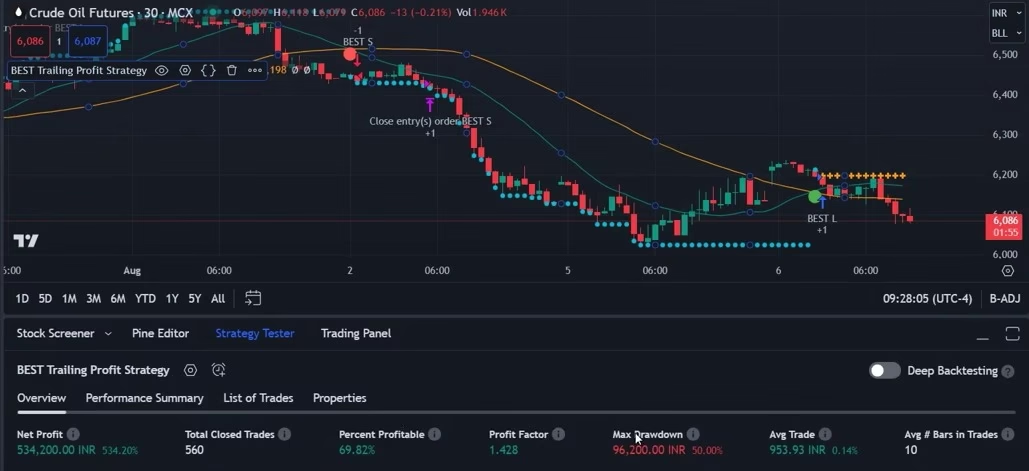
Changing the chart from one hour to 30 minutes produces a different series of simulated orders. The Strategy Tester displays results in the currency of the contract.
Use identical dates, costs and trade-sizing assumptions before comparing time frames.
Testing Different Time Frames
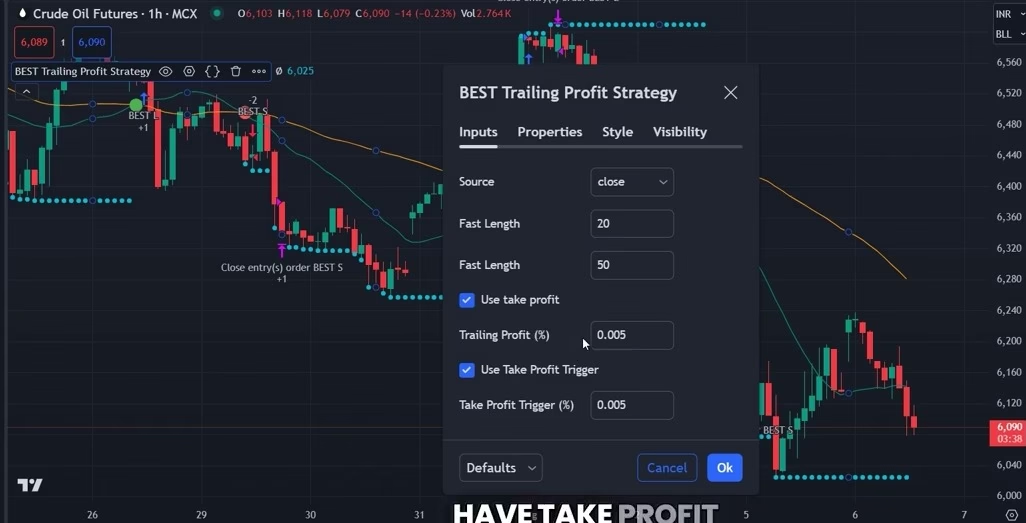
The presenter opens the strategy inputs to show where the take-profit trigger can be changed. Record these settings when you rerun the test.
The crude-oil comparison in this demonstration uses one-hour and 30-minute charts. A 15-minute result requires a separate test.
Creating Alerts for Automation
Automating the trailing take profit strategy through alert creation is a straightforward process. By setting up an alert, traders can receive notifications when specific market conditions are met, allowing for timely execution of trades. This automation streamlines the trading process, reducing the need for constant monitoring and enabling traders to focus on strategy optimisation.
A TradingView alert sends a strategy signal to the configured webhook. Order acceptance and fills depend on the broker connection, order settings and market conditions.
Replaying Signals to Validate Strategies
Bar Replay lets you step through a historical sequence and observe when a signal appears. One replay can reveal an inconsistency, but it cannot establish that a strategy never repaints.
For each signal, record the bar, the strategy settings and whether the signal appears before or after the bar closes.
Steps to Replay and Validate
- Identify key market periods to replay, focusing on volatile or trend-defining moments.
- Use the replay function to simulate trades and observe if signals align with expected outcomes.
- Compare signals before and after the bar closes and record any change.
- Adjust strategy parameters as needed based on insights gained during the replay.
Repeat the check across dates and compare it with forward observations before drawing conclusions.
Evaluating Returns for Different Symbols
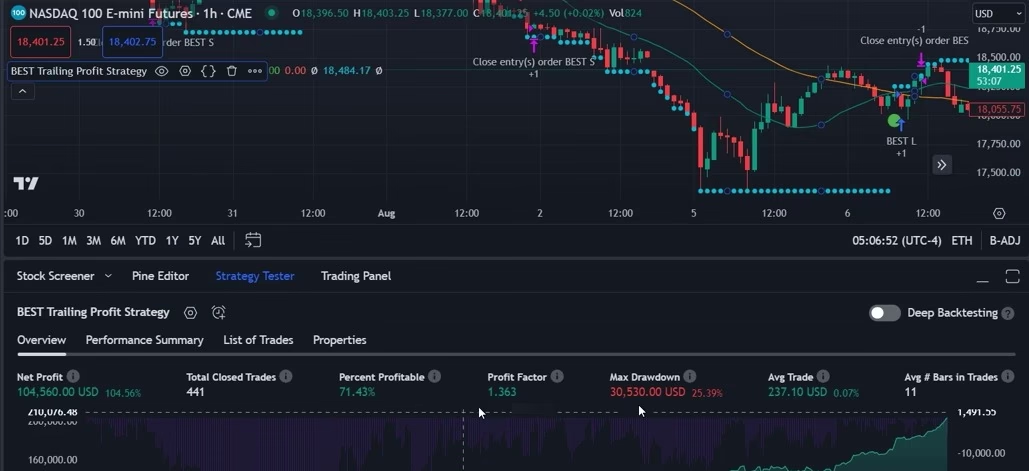
Evaluating a trading strategy across different symbols is essential to understanding its versatility and profitability. Each trading symbol, whether it’s crude oil, the Nasdaq (NQ), or wheat, presents unique characteristics and challenges. By testing the strategy on multiple symbols, traders can identify which assets are most compatible with their approach.
The presenter also runs a simulation on Nasdaq-100 E-mini futures. Keep its currency, contract value and time frame separate from the crude-oil example when comparing net profit or drawdown.
Key Considerations for Symbol Evaluation
- Analyse the historical performance of the strategy on each symbol to identify patterns.
- Adjust risk management settings, such as stop-loss and take profit levels, to suit the volatility of each symbol.
- Consider the liquidity and trading hours of each symbol, as these can impact strategy execution.
Results depend on the chosen dates, instrument and test assumptions.
Comparing Results Across Various Futures
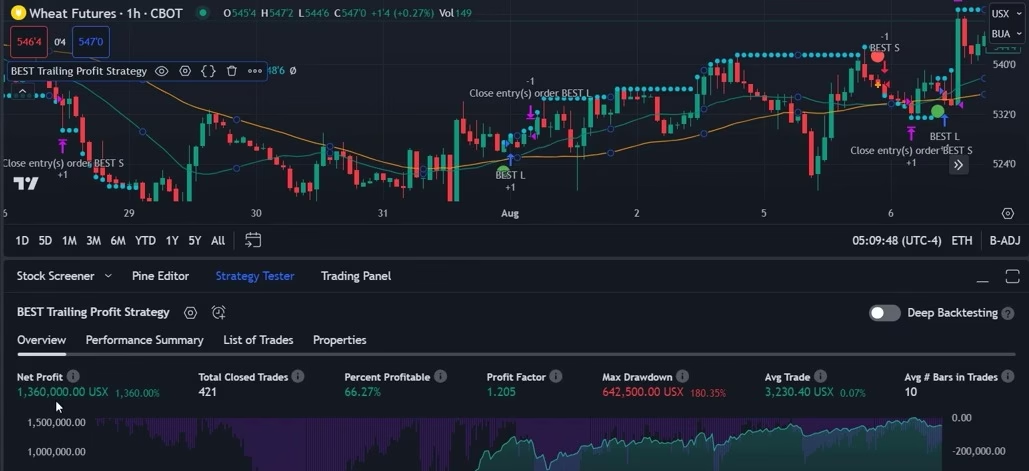
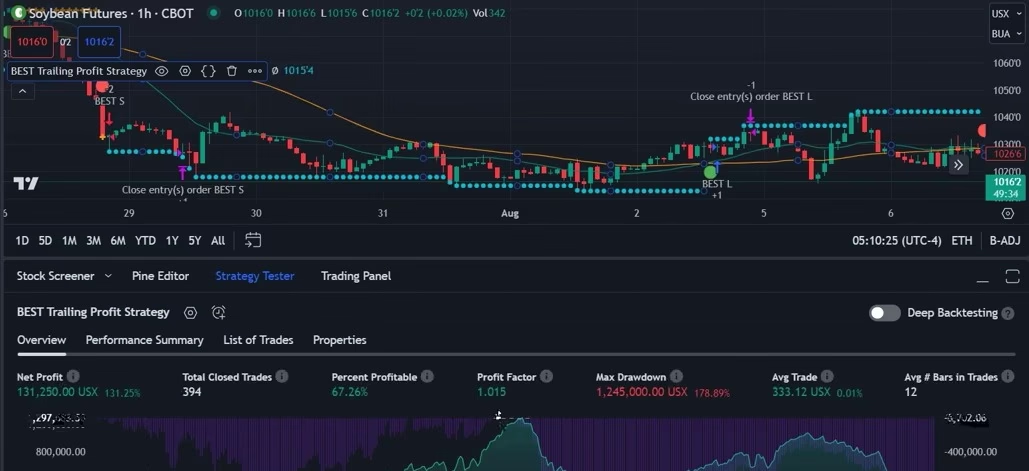
When it comes to futures trading, comparing results across different contracts is vital for strategy optimisation. Futures like wheat and soybean offer diverse opportunities, and understanding how a strategy performs with each can guide traders in choosing the right markets.
The wheat and soybean screens show separate historical simulations. Their drawdowns and simulated profits apply only to the demonstrated settings.
Optimising Strategy for Futures
- Evaluate the volatility and trend patterns of each futures contract to tailor strategy parameters.
- Consider seasonal factors that may affect the performance of agricultural futures like wheat and soybean.
- Use backtesting to simulate different market scenarios and fine-tune the strategy for each futures contract.
Through careful comparison and optimisation, traders can enhance their futures trading strategy, ensuring it aligns with their financial goals and market conditions.
Conclusion and Next Steps
In conclusion, the trailing take profit strategy offers a flexible and effective approach to trading across various symbols and futures. By replaying signals, evaluating returns, and comparing results, traders can compare how the same rules behave under different historical conditions.
As a next step, traders are encouraged to continue testing and refining their strategies using PickMyTrade, leveraging its automation capabilities to streamline the trading process. By staying informed and adaptable, traders can navigate the complexities of the market and achieve their trading objectives.
Frequently Asked Questions
What is the primary advantage of using a trailing take profit strategy?
The strategy adjusts its exit trigger as price moves. The exit price and the outcome of an individual trade can vary.
How can I ensure my strategy does not repaint?
Replay a signal bar by bar and compare it with forward observations. Repeated checks can identify changes, but a historical replay cannot guarantee that signals never repaint.
What should I consider when applying this strategy to different symbols?
Consider each symbol’s volatility, liquidity, and trading hours. Adjust strategy parameters like stop-loss and take profit levels to suit the unique characteristics of each symbol.
PickMyTrade specializes in automating trading bots, enabling seamless strategy execution for futures from platforms like TradingView, across well-known brokers such as Tradovate.
PickMyTrade
PickMyTrade specializes in automating trading bots, enabling seamless strategy execution for futures from platforms like TradingView, across well-known brokers such as Tradovate.