In the world of trading, many focus on win rates, but one number quietly drains accounts without warning — drawdown. It’s not flashy, but it’s deadly. This blog reveals why understanding drawdown is essential and how Maven Automation helps traders minimize its impact.
What Is Drawdown in Trading?
Drawdown refers to the peak-to-trough drop in your trading account during a strategy’s performance. It reflects the maximum pain you could experience before your strategy recovers.
- Shows the risk exposure of your trading strategy.
- Helps determine your emotional and capital tolerance.
Maximum Equity Drawdown in Action
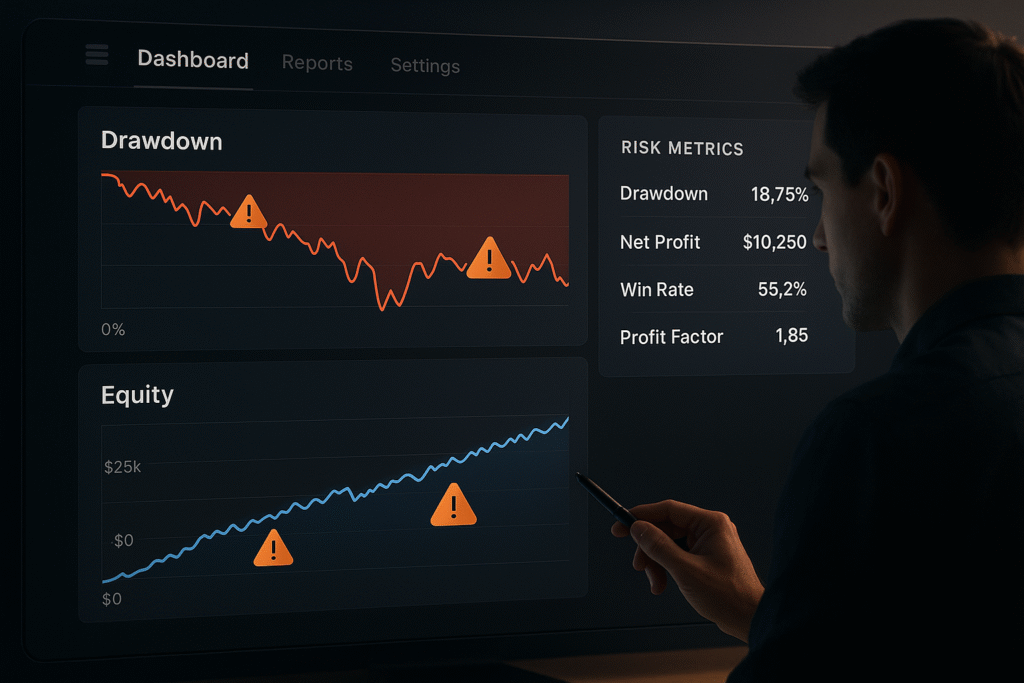
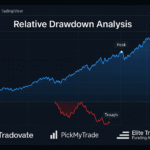
The maximum equity drawdown is the largest single decline observed in your equity curve. Tools like TradingView’s Strategy Tester make this metric easy to analyze.
Example with Maven Automation:
- Supertrend Strategy: 277 trades, 14% drawdown (~$29,000).
- 3 RSI Strategy: 30 trades, but a massive 10%+ drawdown (~$110,000).
Insight: Fewer trades don’t mean safer trades. Drawdown size matters more than frequency.
Why Win Rate Isn’t Enough
You could win 80% of trades and still lose money if the 20% losers are massive. Maven Automation emphasizes analyzing drawdown over win rate to avoid misleading performance metrics.
“Don’t let a 70% win rate blind you to a -$50,000 drawdown.”
– Maven Automation Strategy Alert
Using TradingView to Track Drawdowns
Visual tools make understanding drawdowns easier.
- Equity Curve: Shows growth or decline in your account.
- Drawdown Curve: Shows the intensity and frequency of losses.
How to View:
- Open Strategy Tester in TradingView.
- Click on the “Equity” or “Drawdown” graph tabs.
- Compare different strategies using drawdown trends.
Risk Management with Maven Automation
Maven Automation helps users evaluate strategies based on real risk metrics, not just surface-level win rates. Knowing your drawdown allows for better:
- Capital allocation
- Strategy selection
- Mental preparation
It prevents emotional trading caused by unexpected big losses.
Safer Risk Profiles Start with Drawdown Awareness
Understanding drawdown is the first step to creating risk-balanced strategies. In the next post, we’ll explore how to structure a safer risk profile using Maven Automation’s tools.
Conclusion: Drawdown Is a Silent Strategy Killer
Many strategies fail not because they lose often — but because they lose too much in one go. Drawdown reveals this silent risk. Tools like Maven Automation not only help you track drawdowns but also optimize your trading plans around them.
Ready to trade smarter?
Don’t just chase win rates — track, understand, and control your drawdown with Maven Automation.
Also Checkout: Connect Tradovate with Trading view using PickMyTrade
Great breakdown of why focusing purely on win rates is dangerous. I’d love to hear your thoughts on how to set acceptable drawdown thresholds for different account sizes or risk profiles. It seems like that’s one area many traders overlook until it’s too late.