In this comprehensive guide, we will explore essential chart patterns that every trader should know to enhance their trading strategies. By leveraging the insights from PickMyTrade, you can gain a significant advantage in identifying market trends and making informed decisions.
Table of Contents
- Step 1: Introduction to Chart Patterns
- Step 2: Understanding the Head and Shoulders Pattern
- Step 3: Exploring Double Tops
- Step 4: Identifying Double Bottoms
- Step 5: Analyzing the Cup and Handle Pattern
- Step 6: Understanding Triangle Patterns
Step 1: Introduction to Chart Patterns
Chart patterns are essential tools for traders, acting as a visual representation of market psychology and helping identify potential future price movements. Understanding these patterns can significantly enhance your trading strategy, allowing you to anticipate market changes and make informed decisions.
Step 2: Understanding the Head and Shoulders Pattern
What is the Head and Shoulders Pattern?
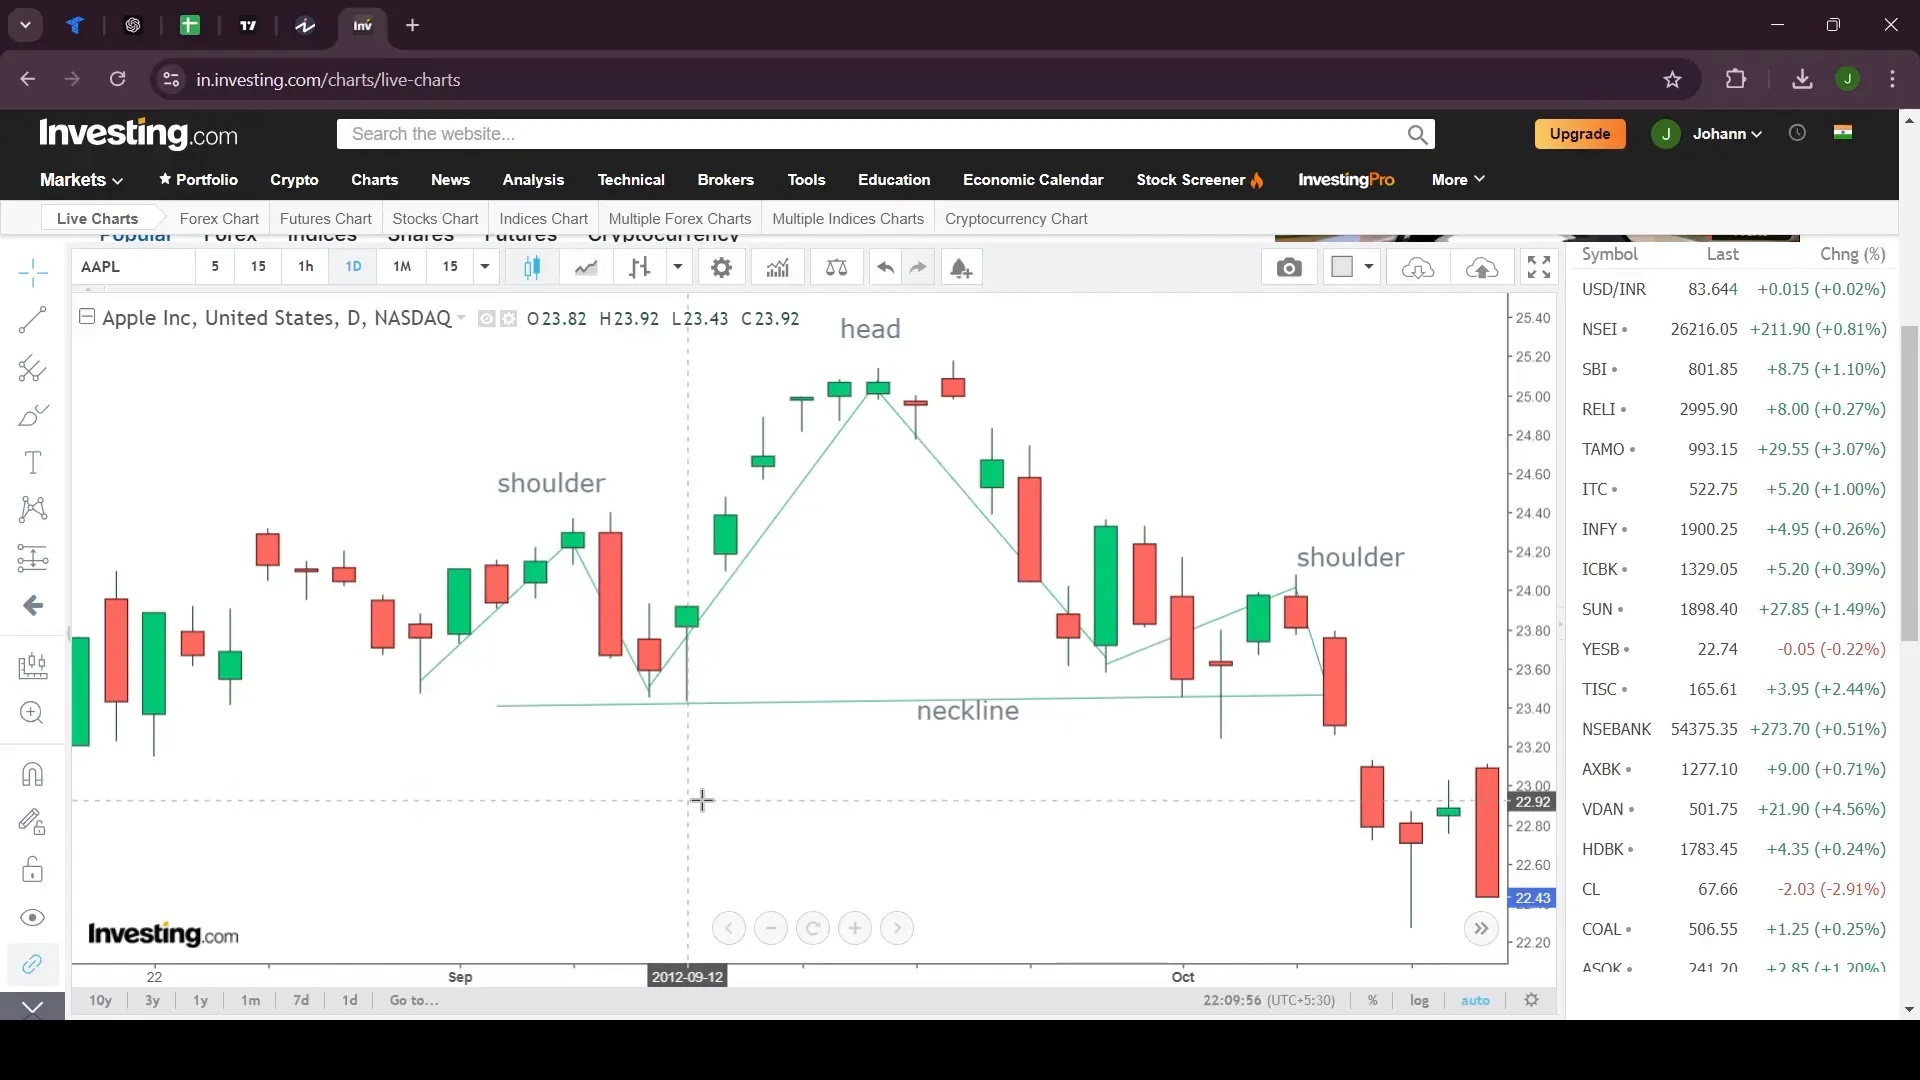
The Head and Shoulders pattern is a classic reversal pattern that signals a change in trend direction. It typically appears at the end of an uptrend and is characterized by three peaks: the central peak (head) being the highest, flanked by two smaller peaks (shoulders).
Recognizing the Neckline
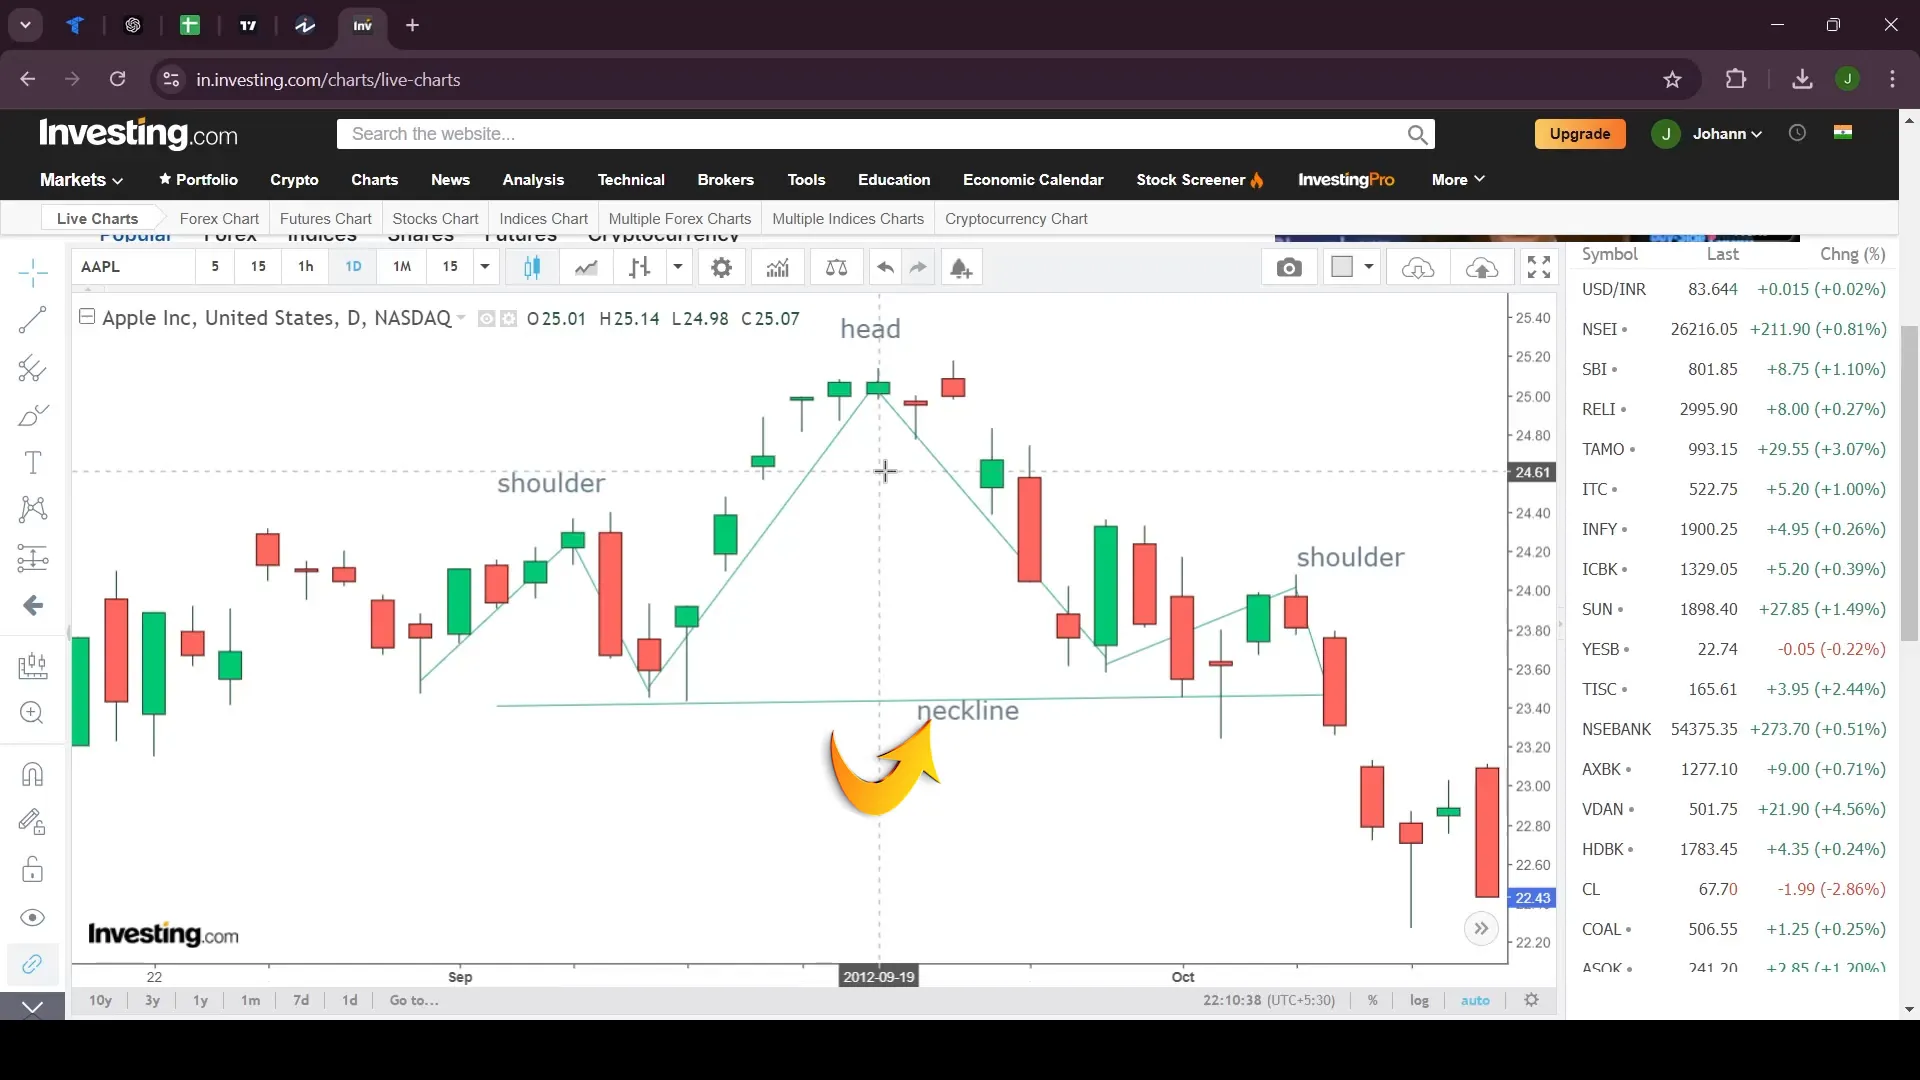
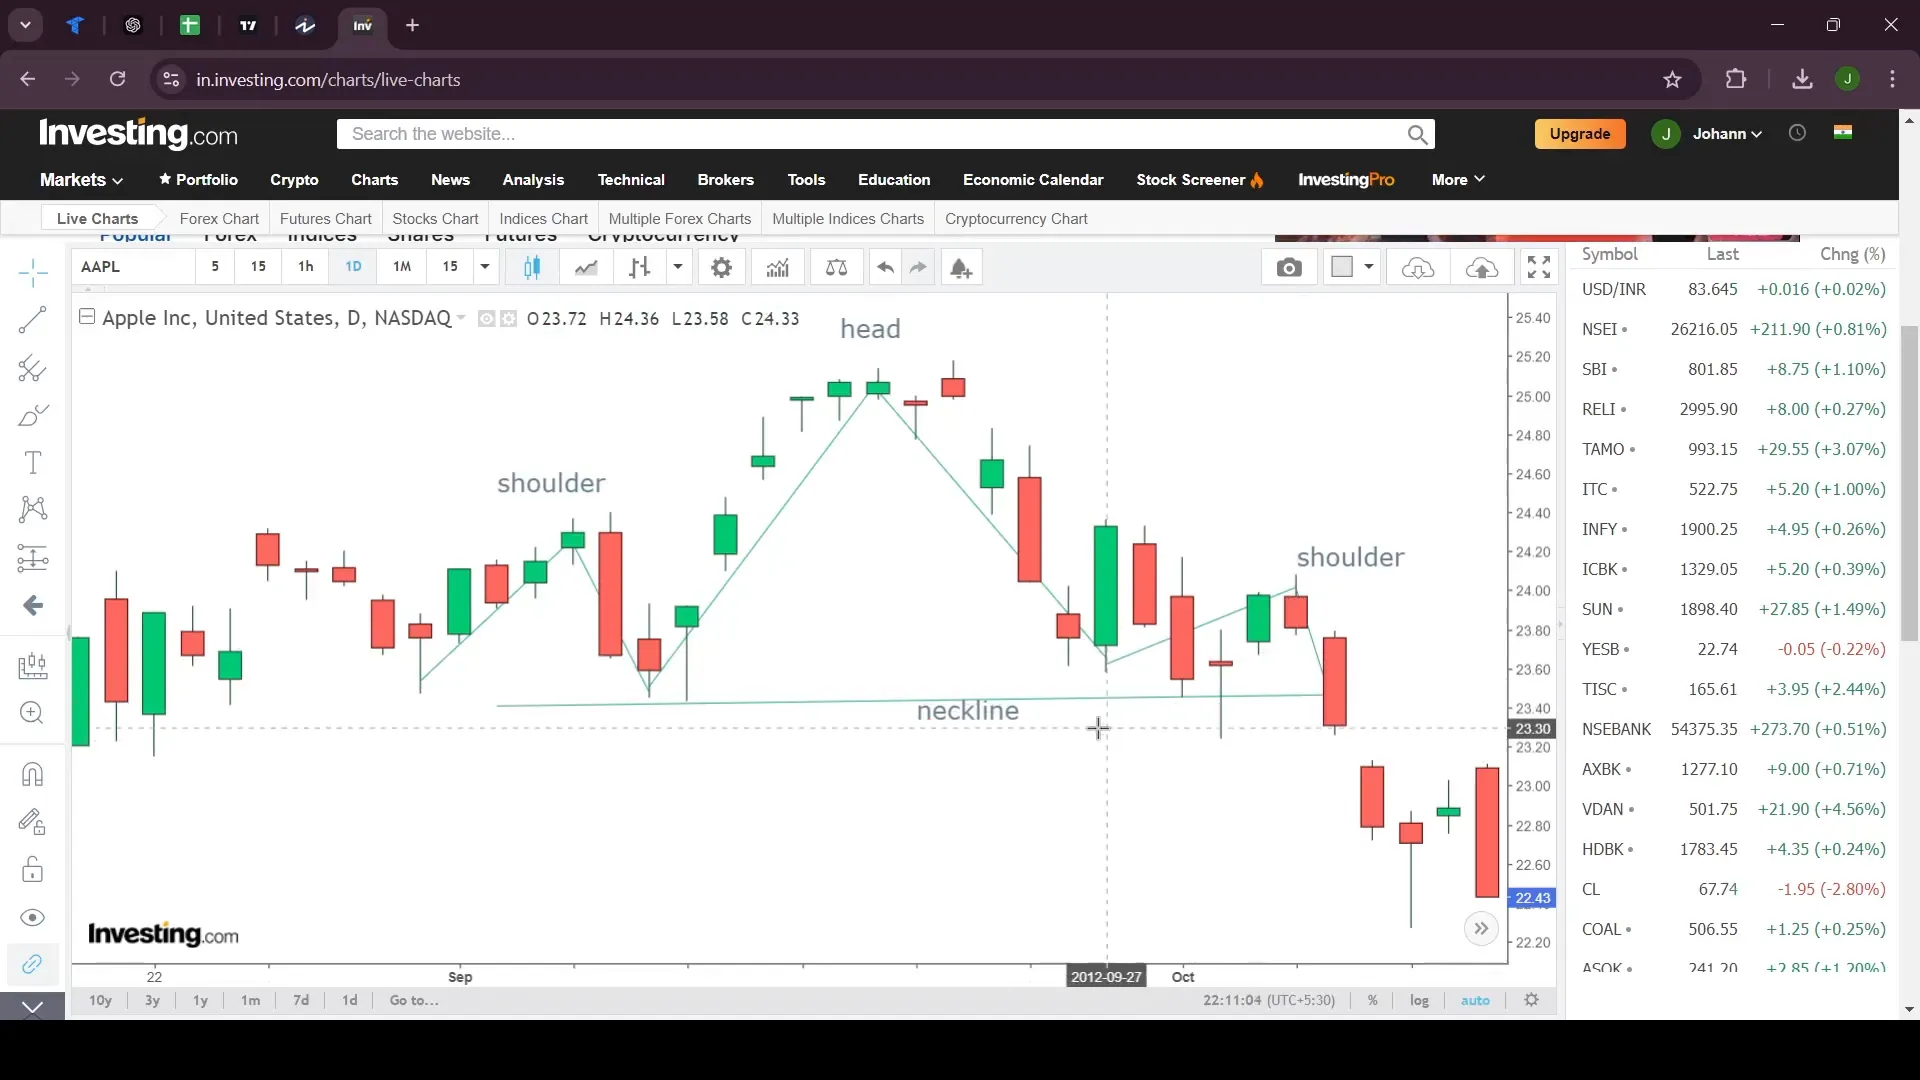
The neckline is a critical component of this pattern. It connects the lows of the two troughs between the head and the shoulders. The pattern is confirmed when the price breaks below the neckline, indicating a potential downtrend.
Real-World Example
In the Apple 2012 chart, a clear Head and Shoulders pattern emerged, leading to a significant price drop once the neckline was breached. This case exemplifies how powerful this pattern can be in predicting market movements.
Step 3: Exploring Double Tops
Defining the Double Top Pattern
The Double Top is a bearish reversal pattern resembling an ‘M’ shape. It forms after an uptrend and consists of two peaks of similar height, indicating a potential shift from bullish to bearish sentiment.
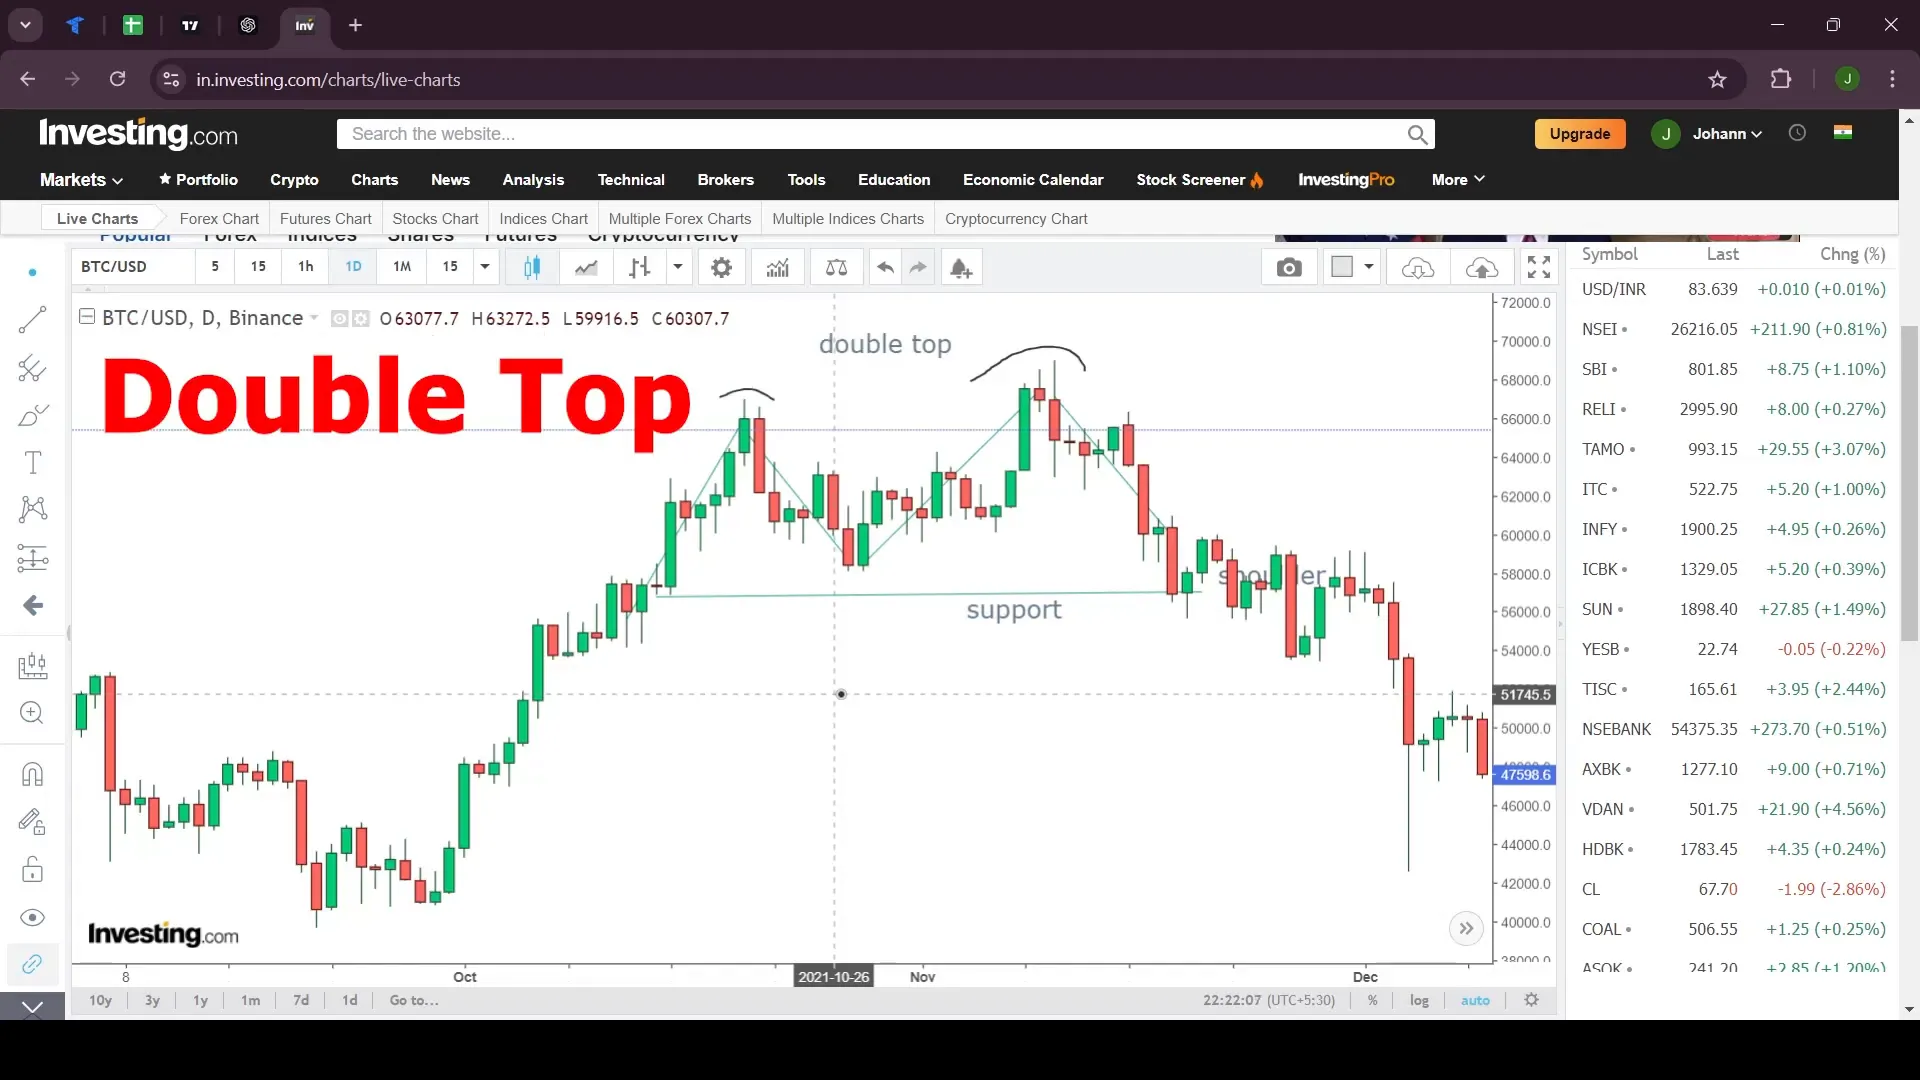
Importance of the Support Line
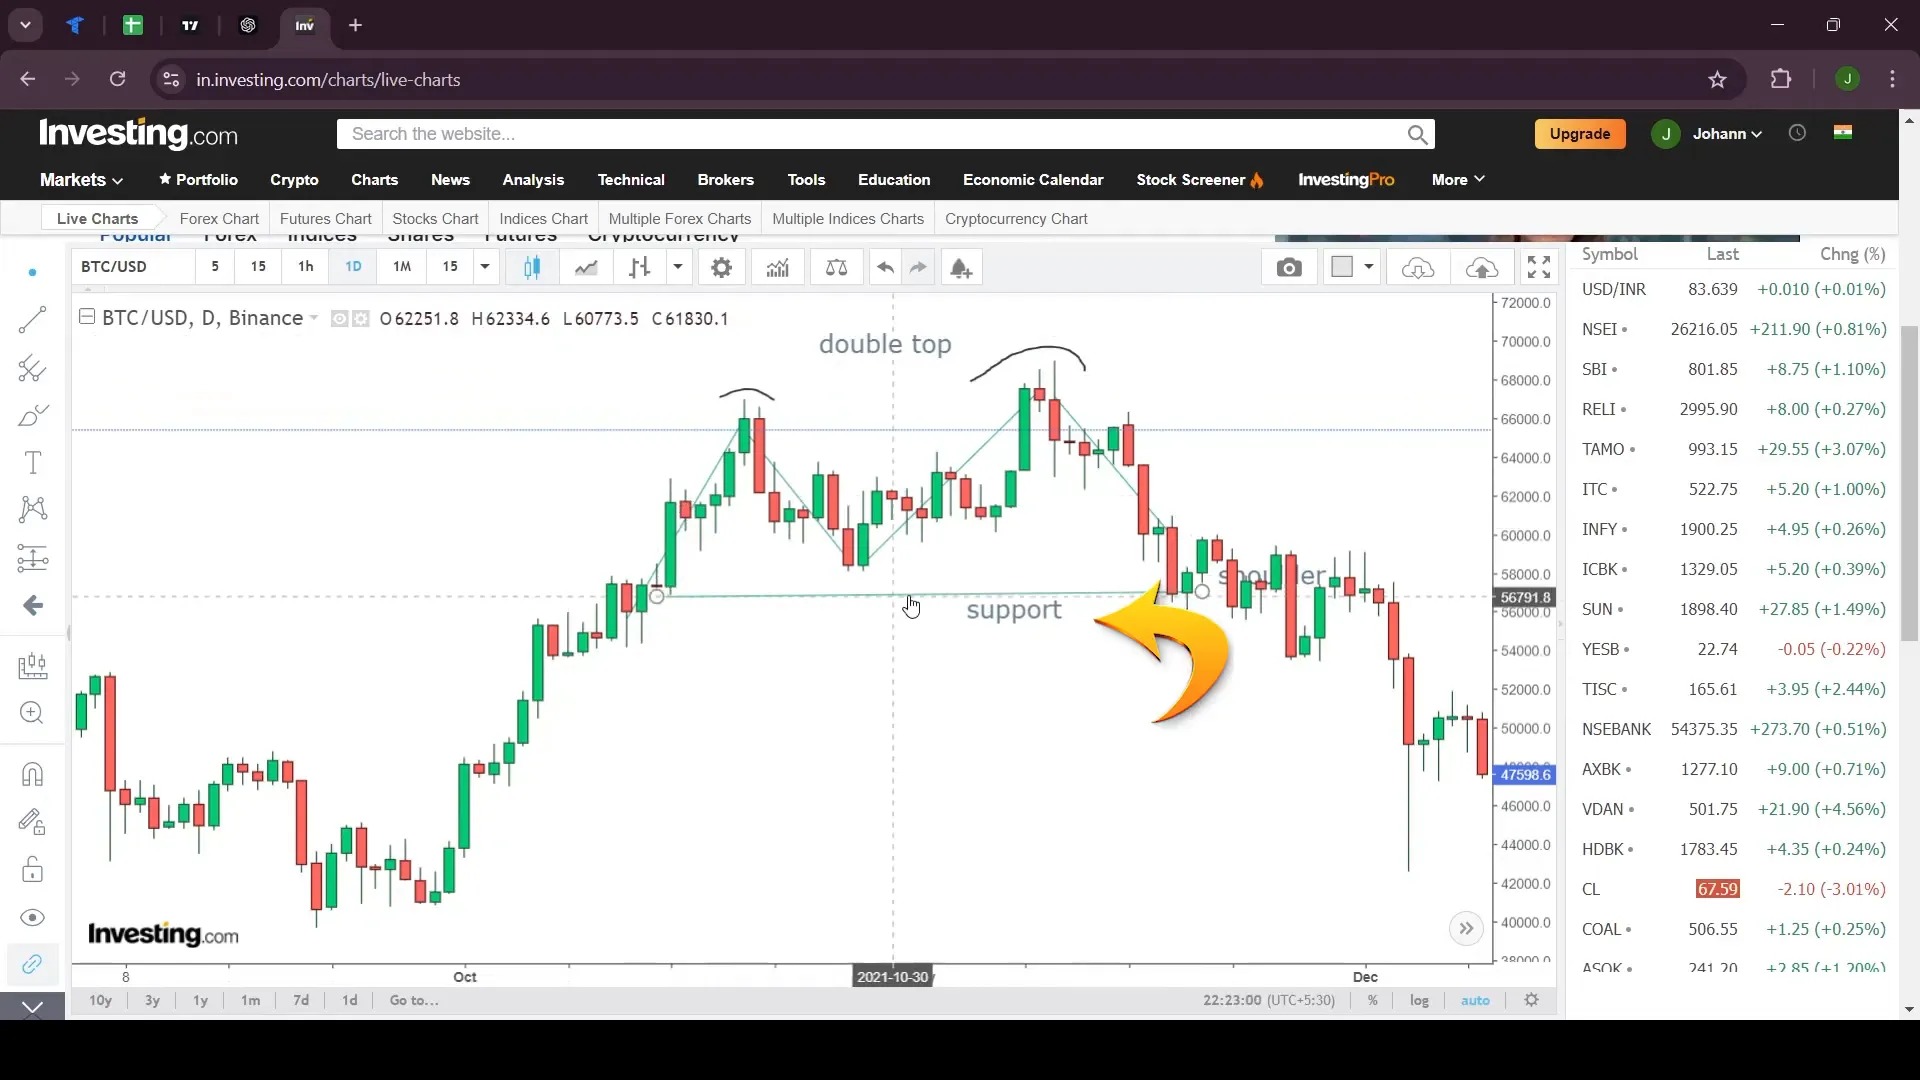
The support line plays a crucial role in confirming the Double Top pattern. Once the price breaks below this line, it suggests the onset of a downtrend, providing traders with a potential selling opportunity.
Application in Trading
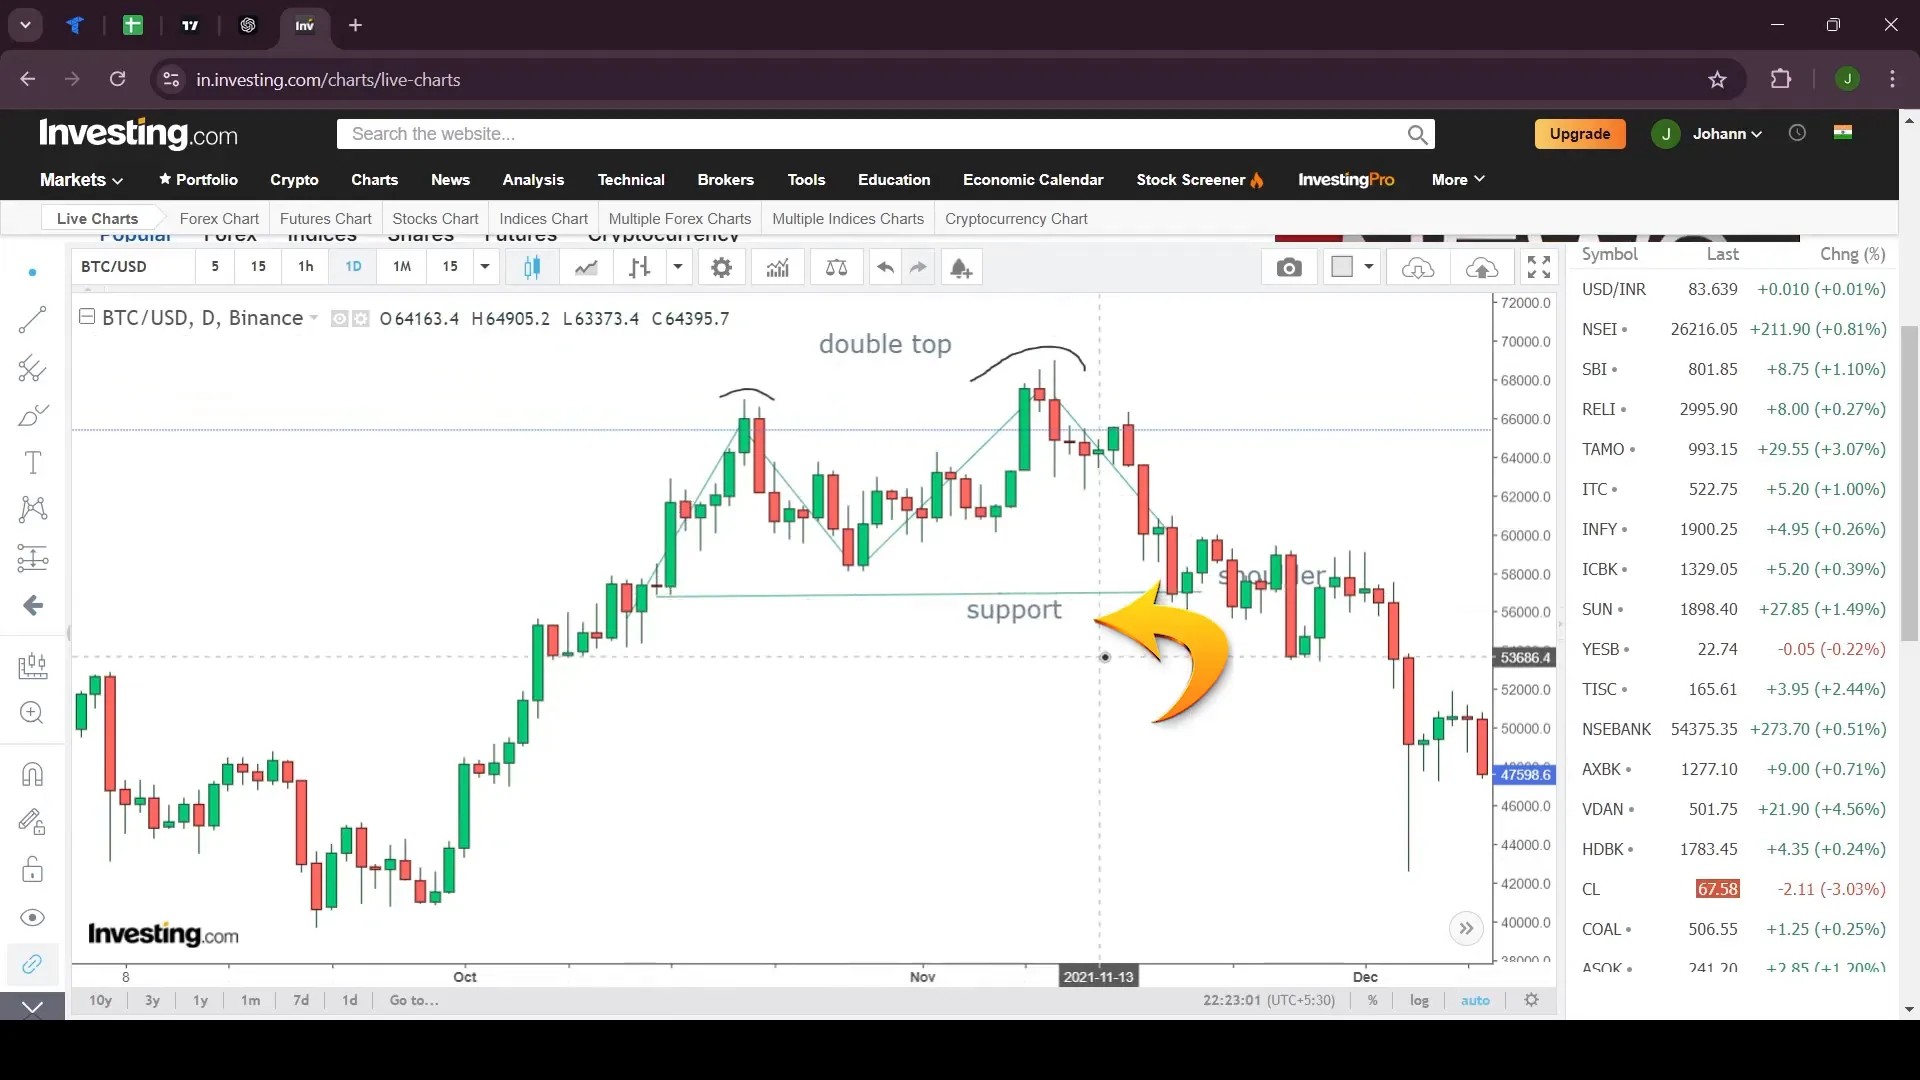
Traders can leverage the Double Top pattern to identify potential reversal points and capitalize on downward price movements. Recognizing this pattern early can help in making timely exit decisions from long positions.
Step 4: Identifying Double Bottoms
Understanding the Double Bottom Pattern
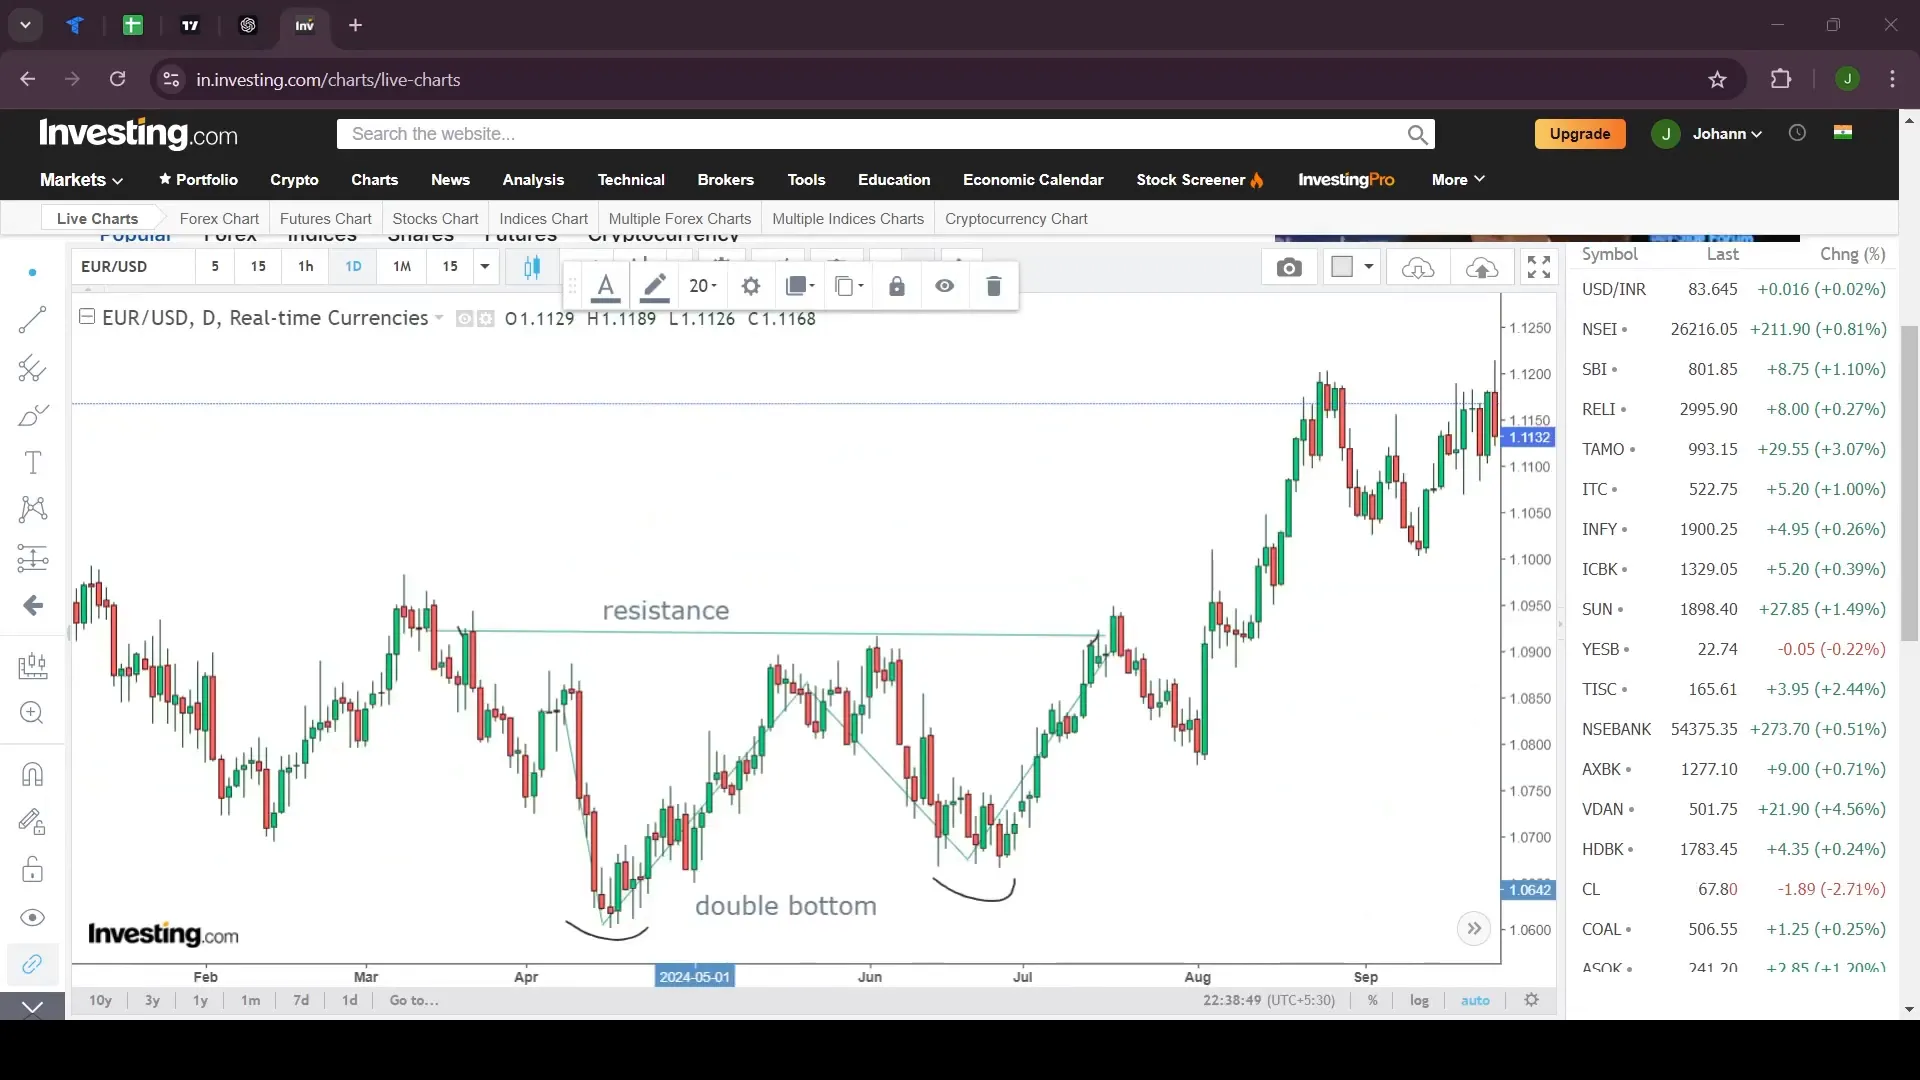
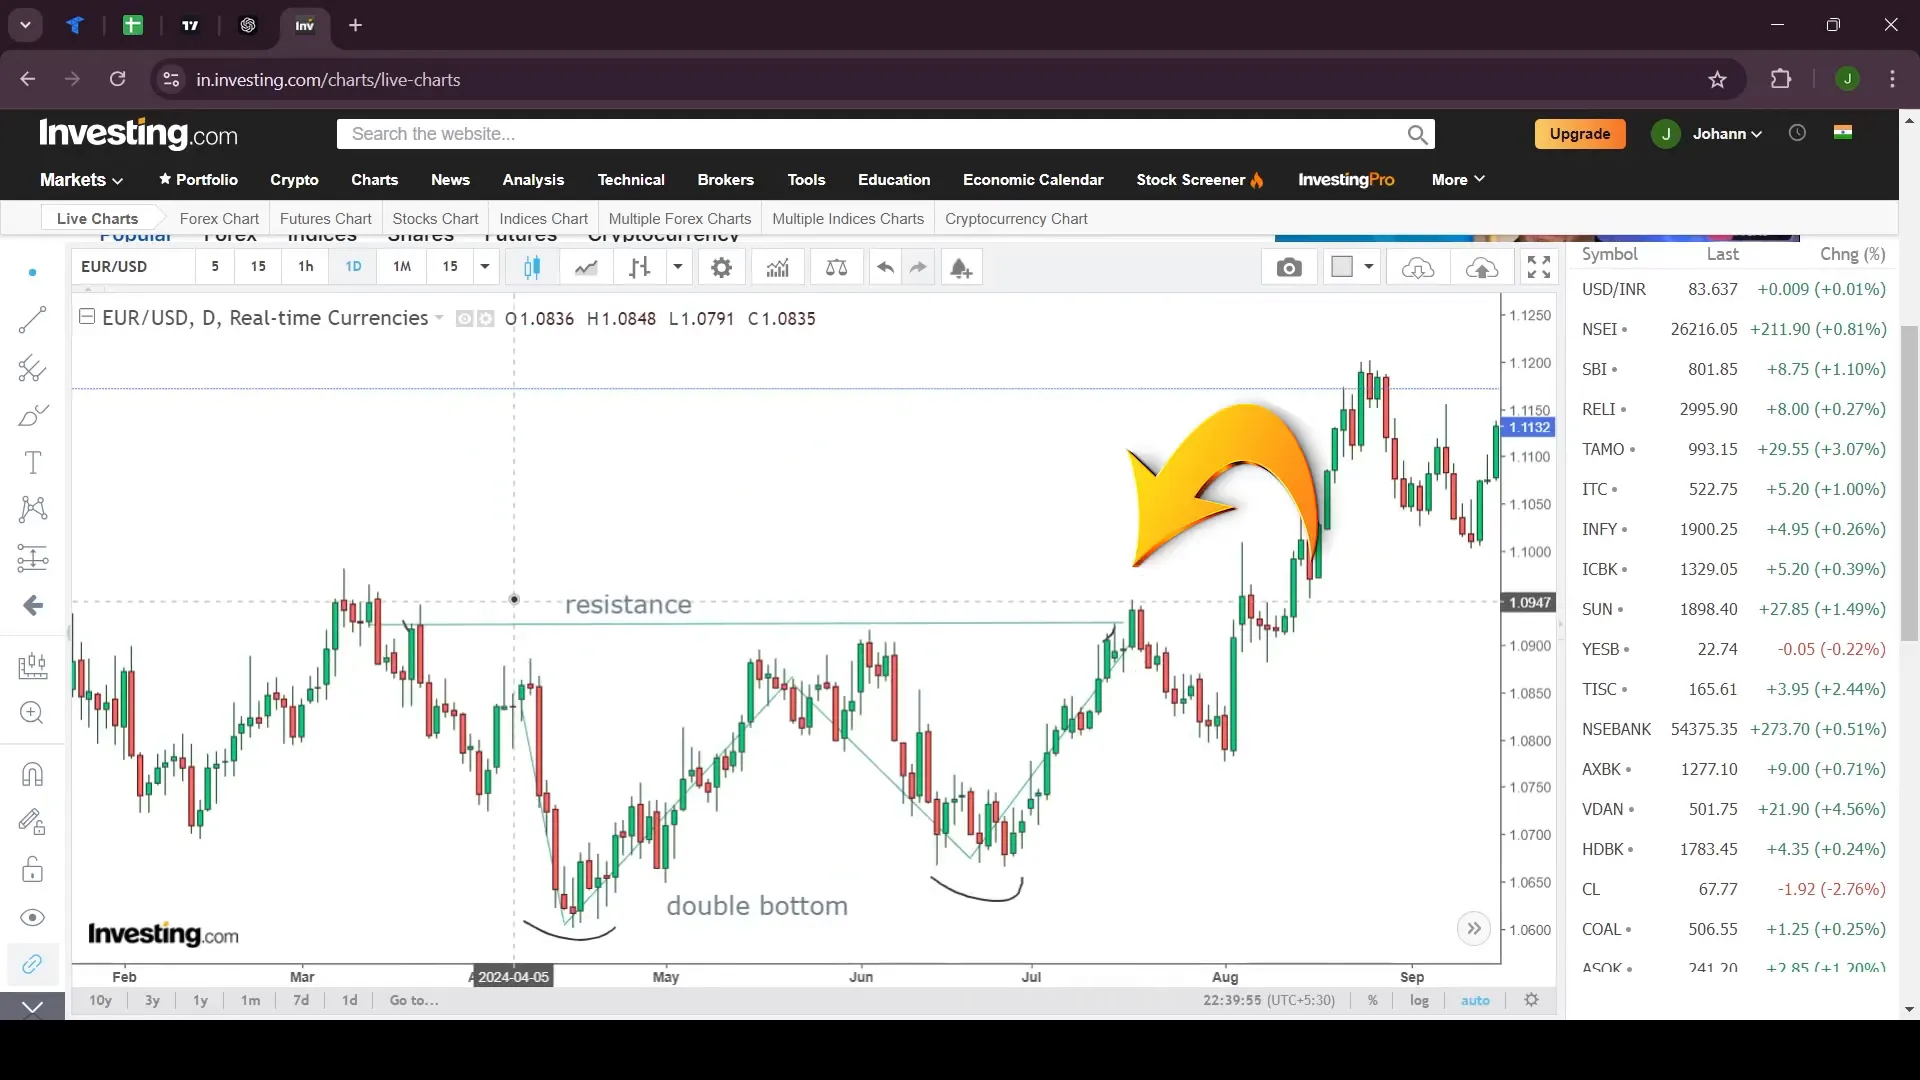
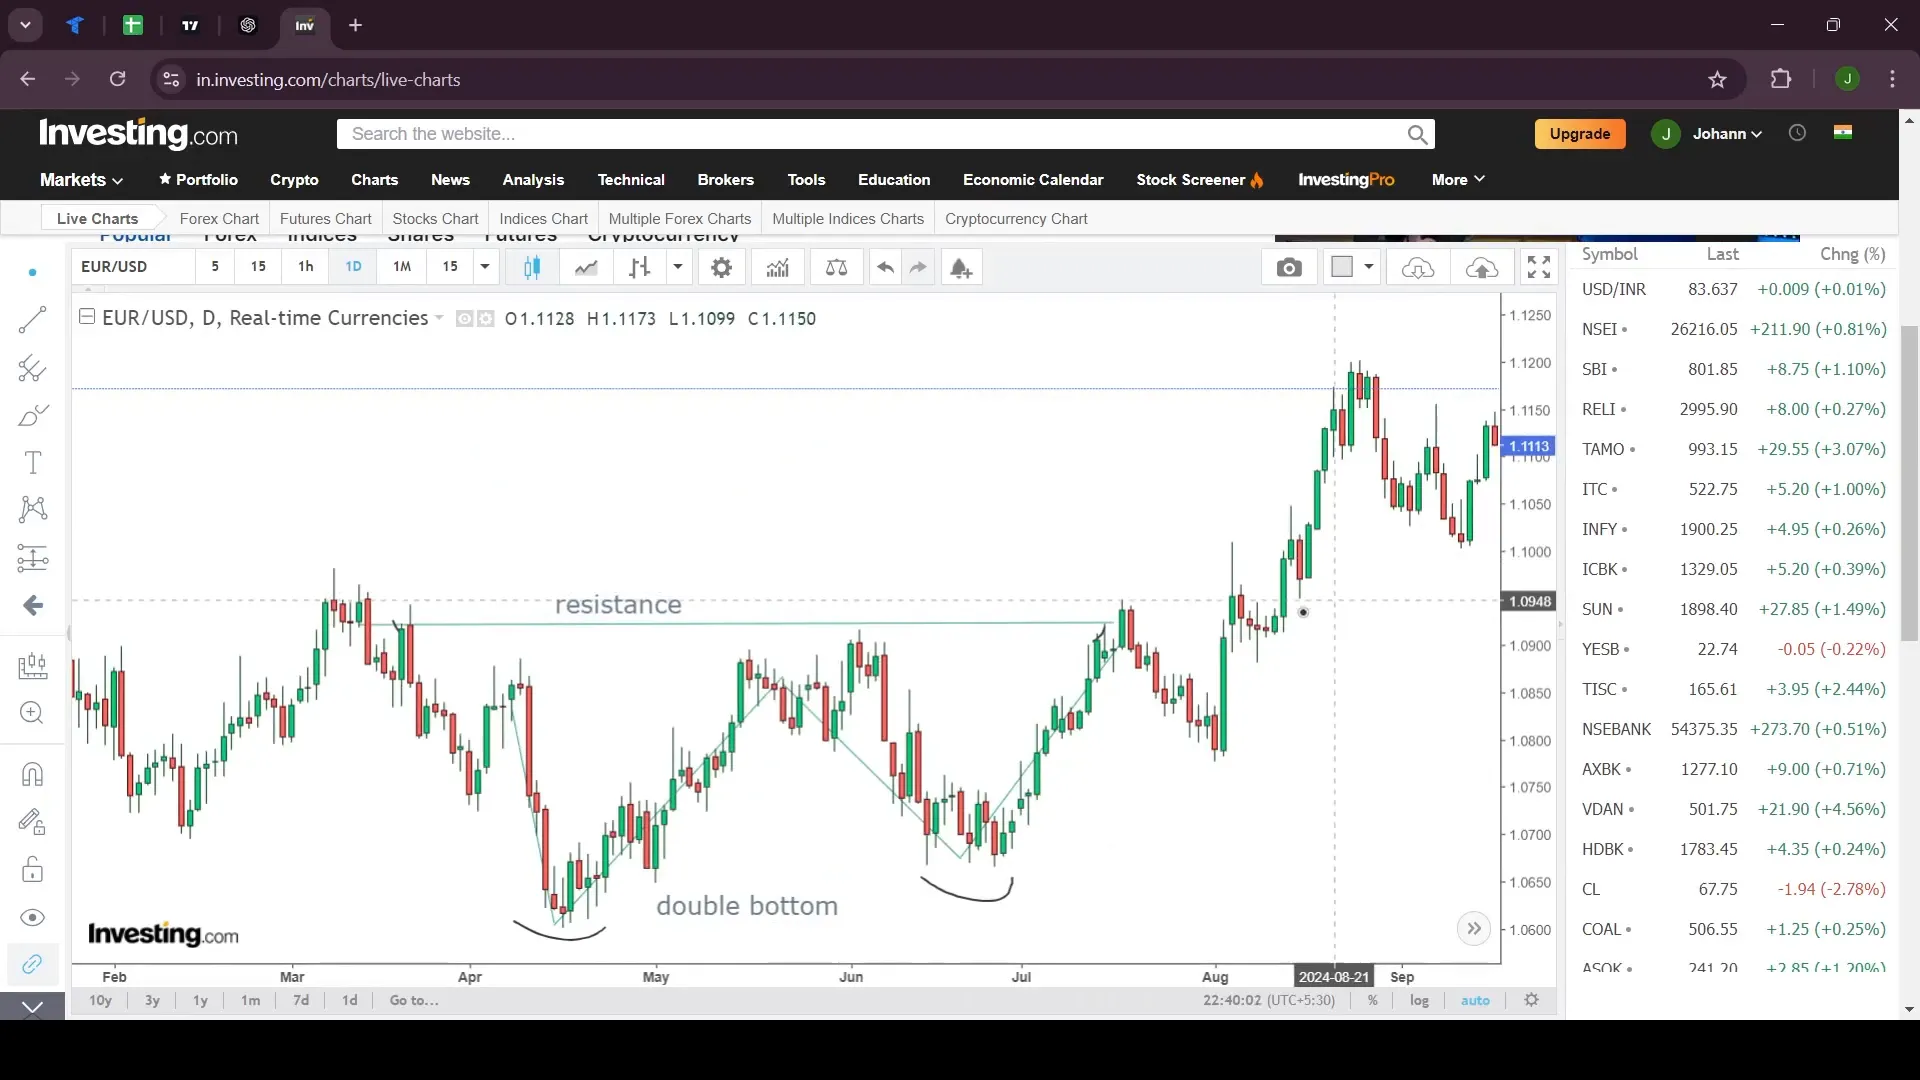
The Double Bottom is a bullish reversal pattern, often appearing at the end of a downtrend. It resembles a ‘W’ shape and consists of two troughs at approximately the same level, indicating a potential shift from bearish to bullish sentiment.
Role of the Resistance Line
The resistance line is key to the Double Bottom pattern. When the price breaks above this line, it signals a potential uptrend, offering traders a buying opportunity.
Trading Strategy with Double Bottoms
Double Bottoms can be used to identify potential entry points for long positions. By recognizing this pattern, traders can anticipate upward price movements and adjust their strategies accordingly.
Step 5: Analyzing the Cup and Handle Pattern
Introduction to the Cup and Handle Pattern
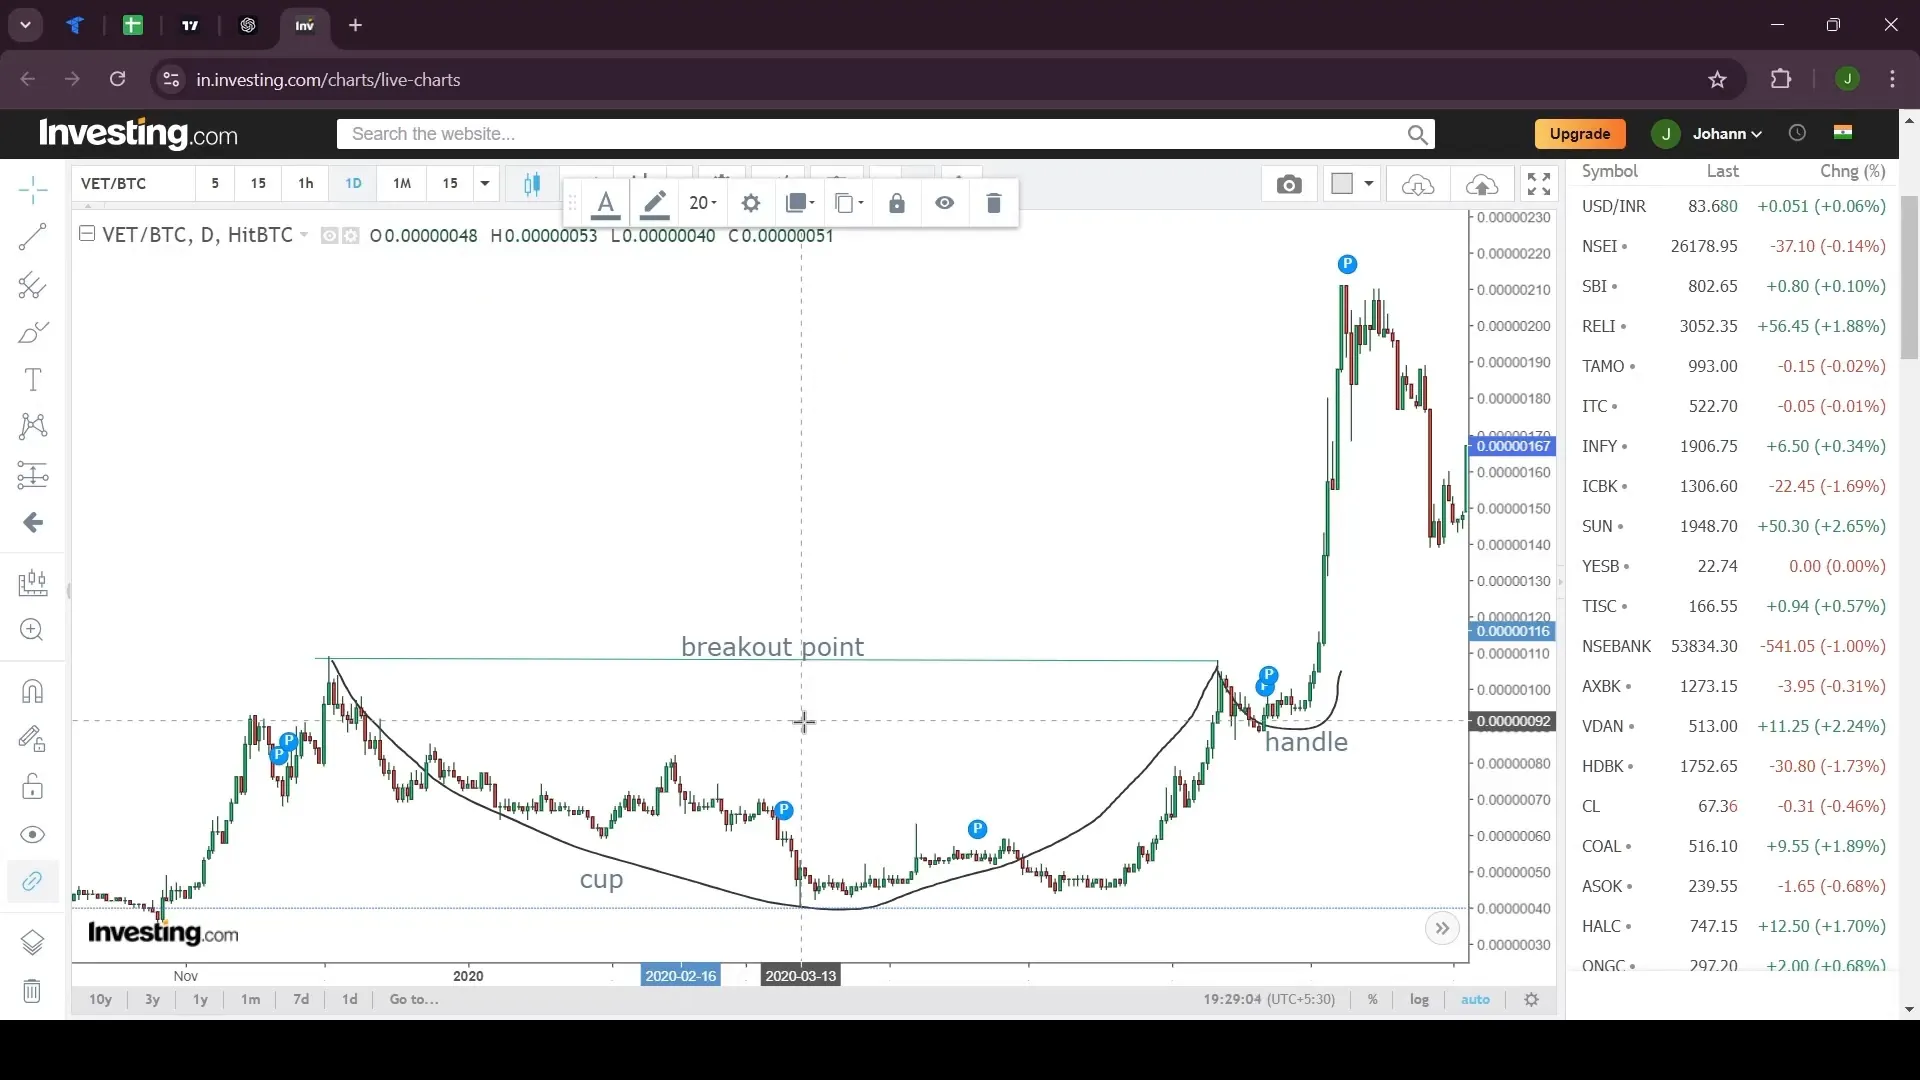
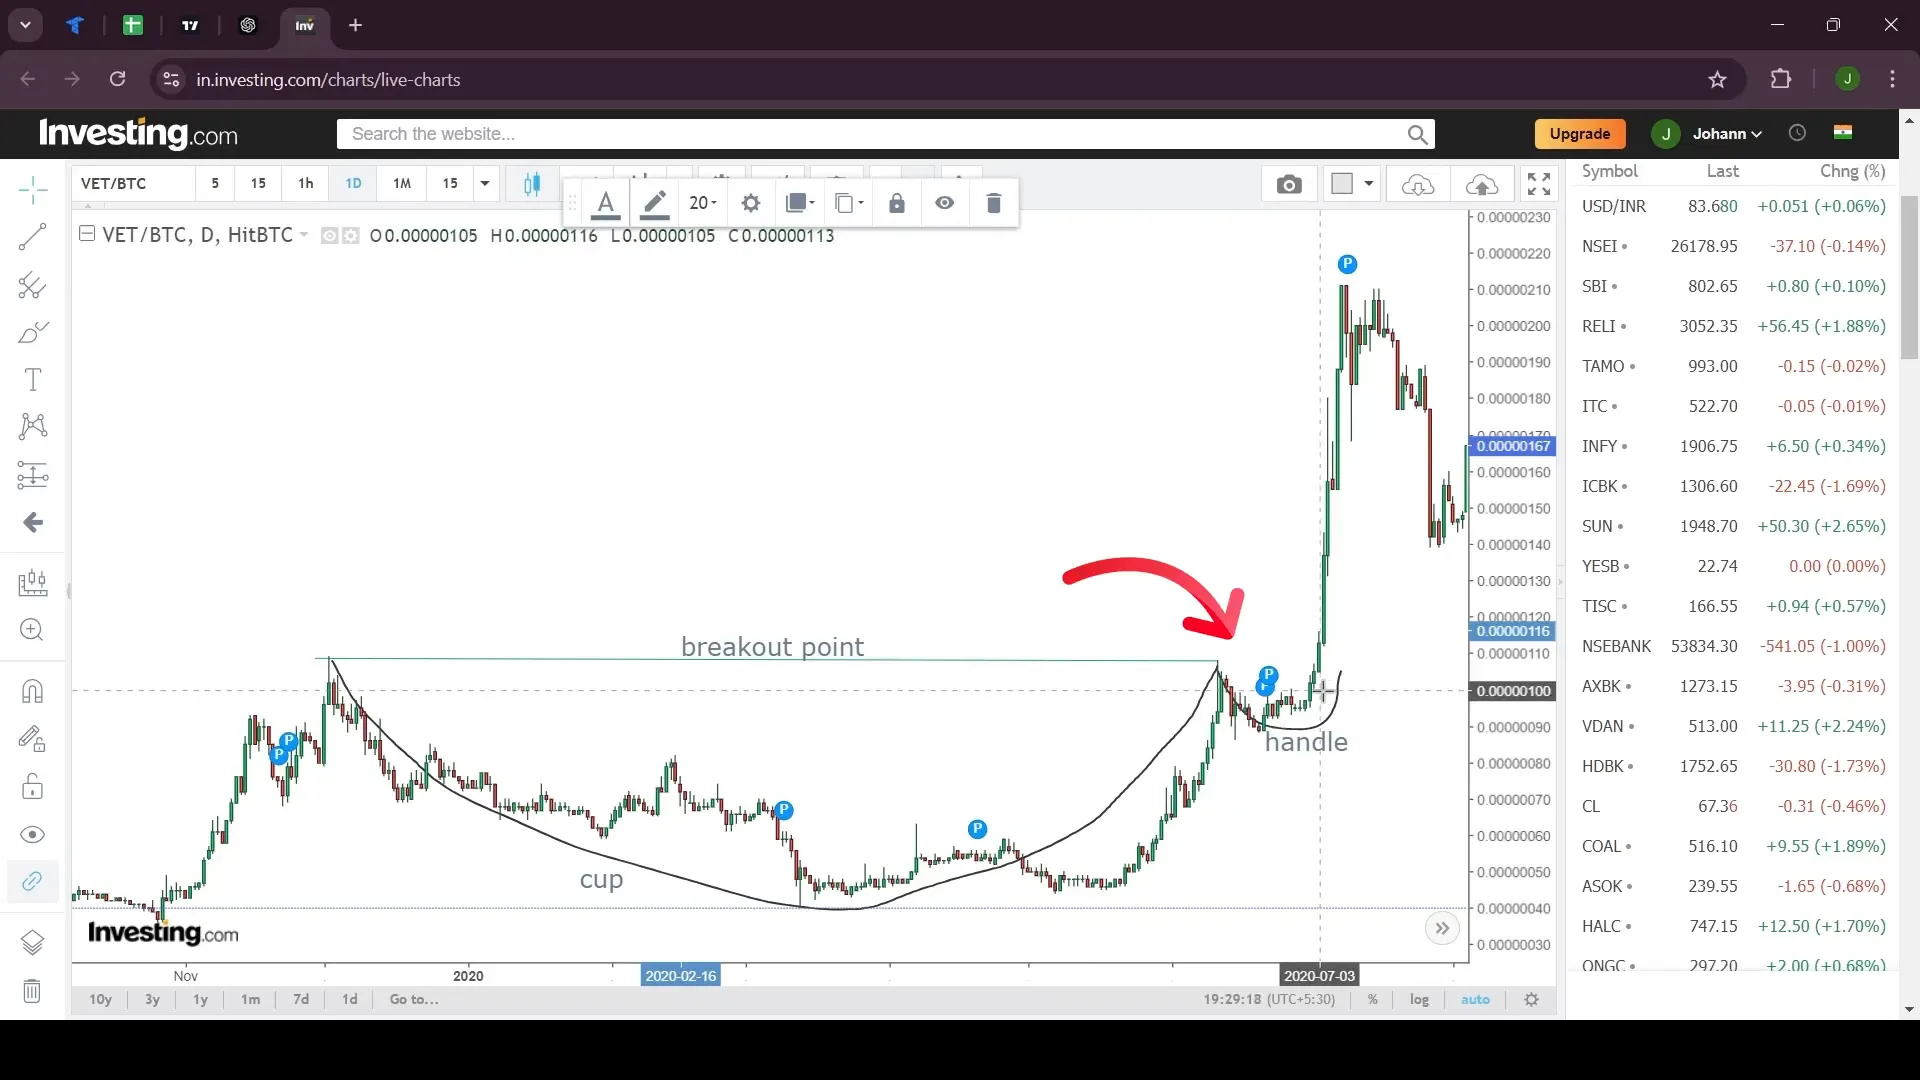
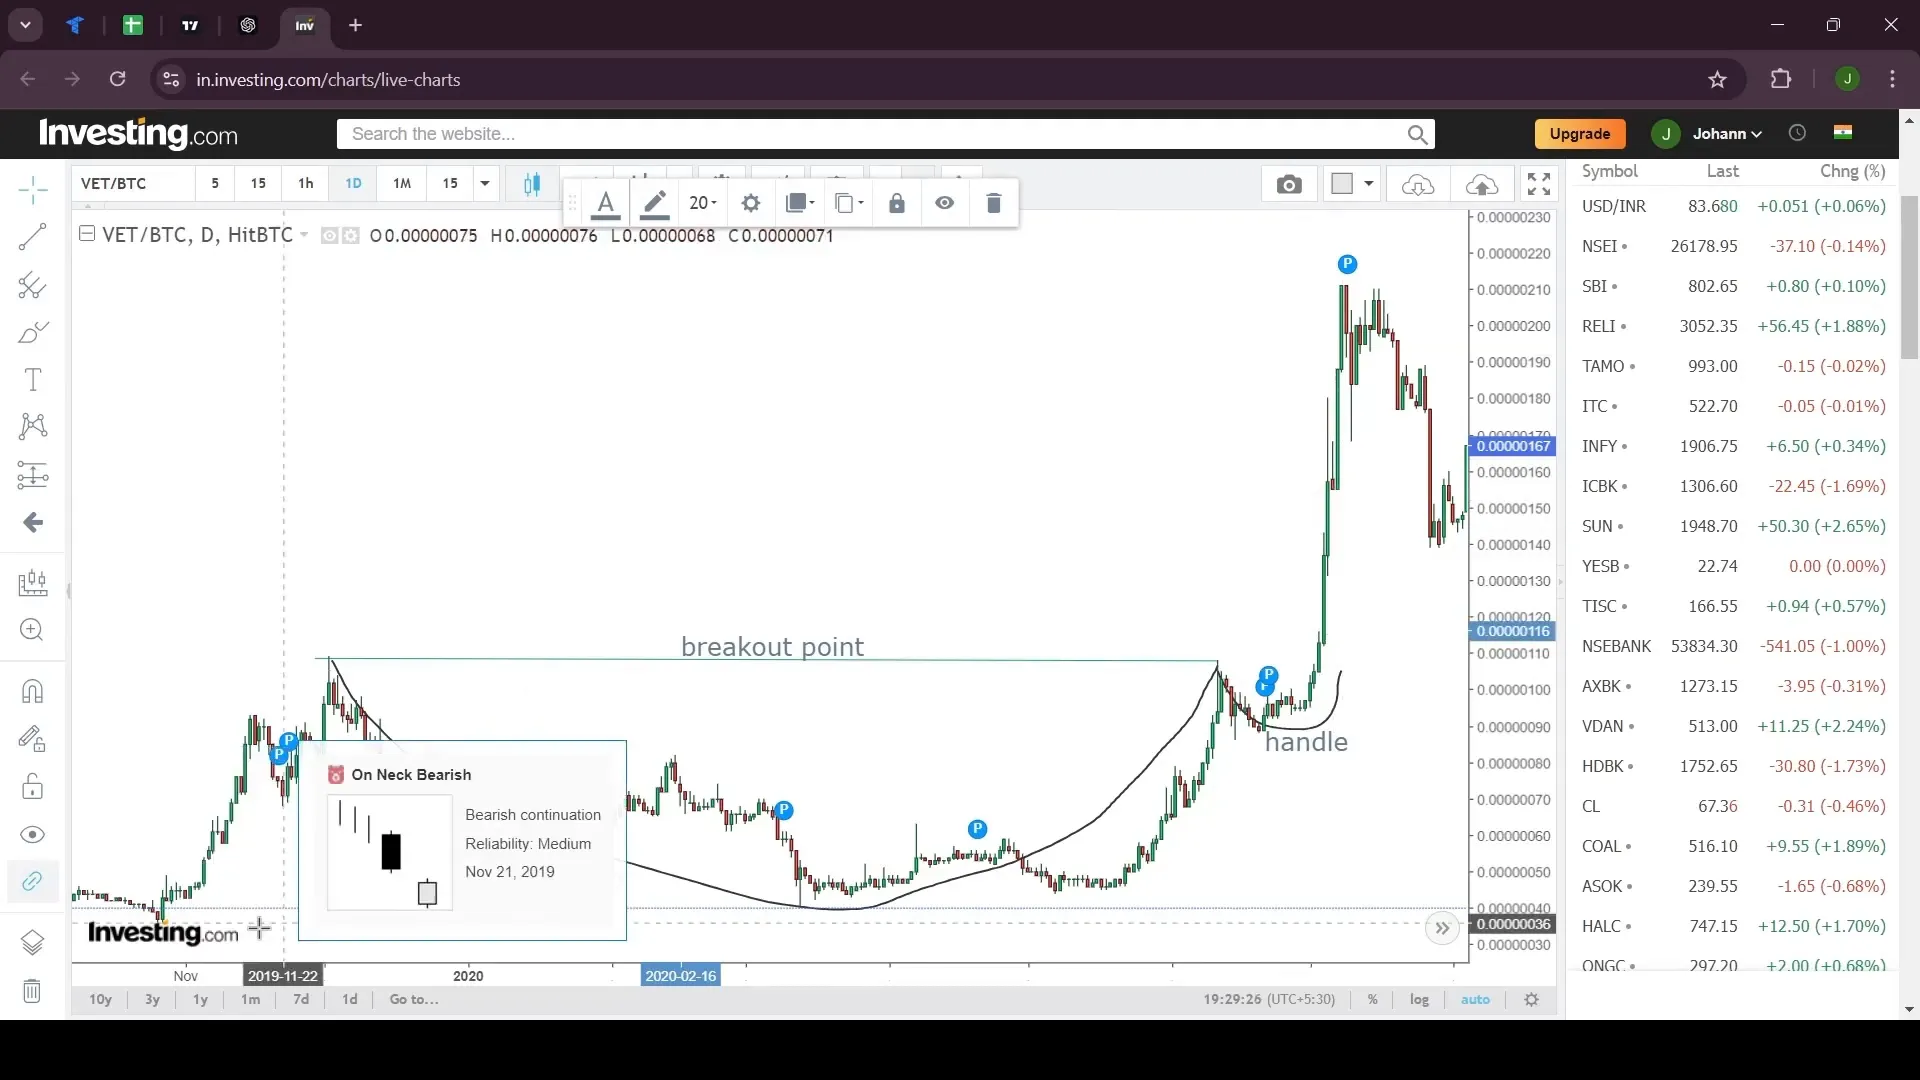
The Cup and Handle is a bullish continuation pattern, resembling a teacup with a handle. It typically forms in an uptrend and indicates a pause before the trend continues upwards.
The Formation of the Cup and Handle
The pattern consists of a ‘U’-shaped cup followed by a consolidation period forming the handle. The breakout from the handle signals the continuation of the uptrend.
Utilizing the Cup and Handle in Trading
Traders can use the Cup and Handle pattern to identify continuation points in an uptrend. Recognizing this pattern can aid in making strategic buying decisions, aligning with the overall market direction.
Step 6: Understanding Triangle Patterns
Variations of Triangle Patterns
Triangle patterns are versatile chart formations that can signal either continuation or reversal. They come in three main types: ascending, descending, and symmetrical triangles, each with unique characteristics and implications for price movement.
Ascending Triangle Pattern
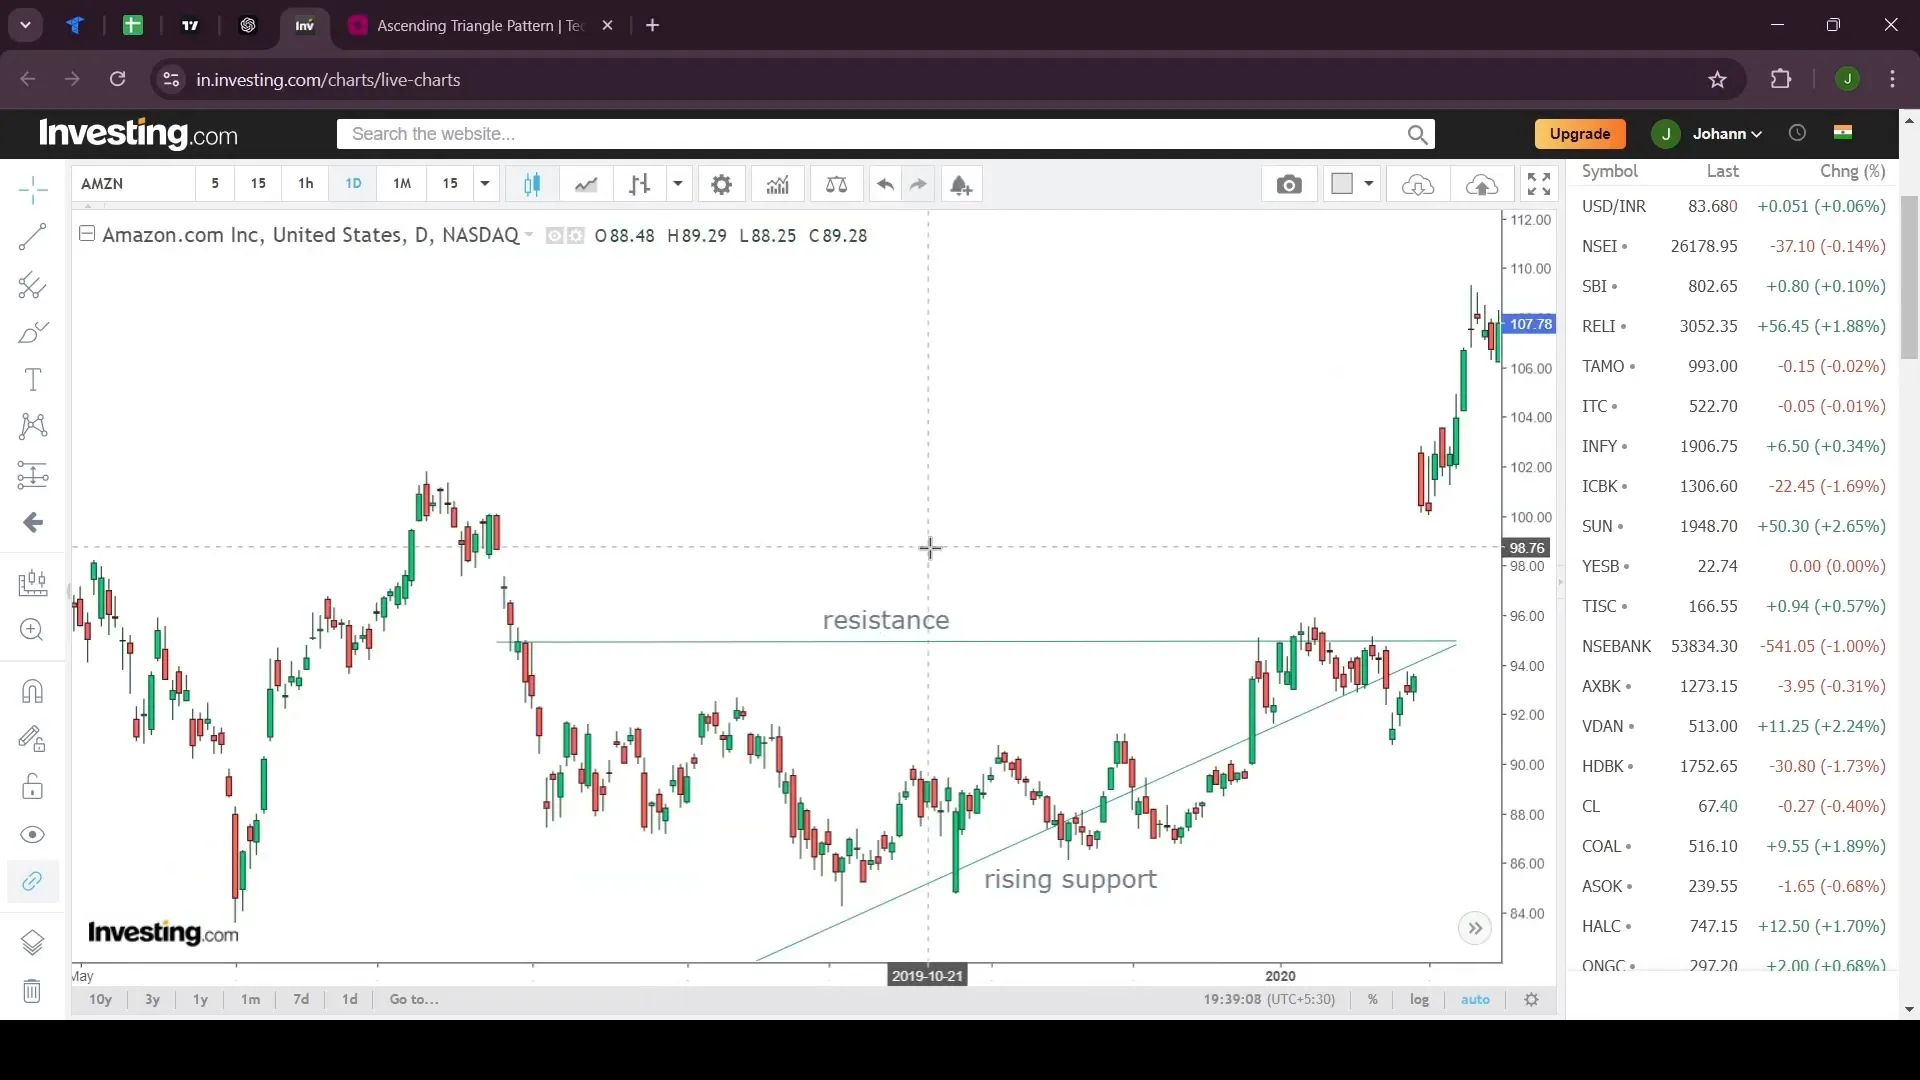
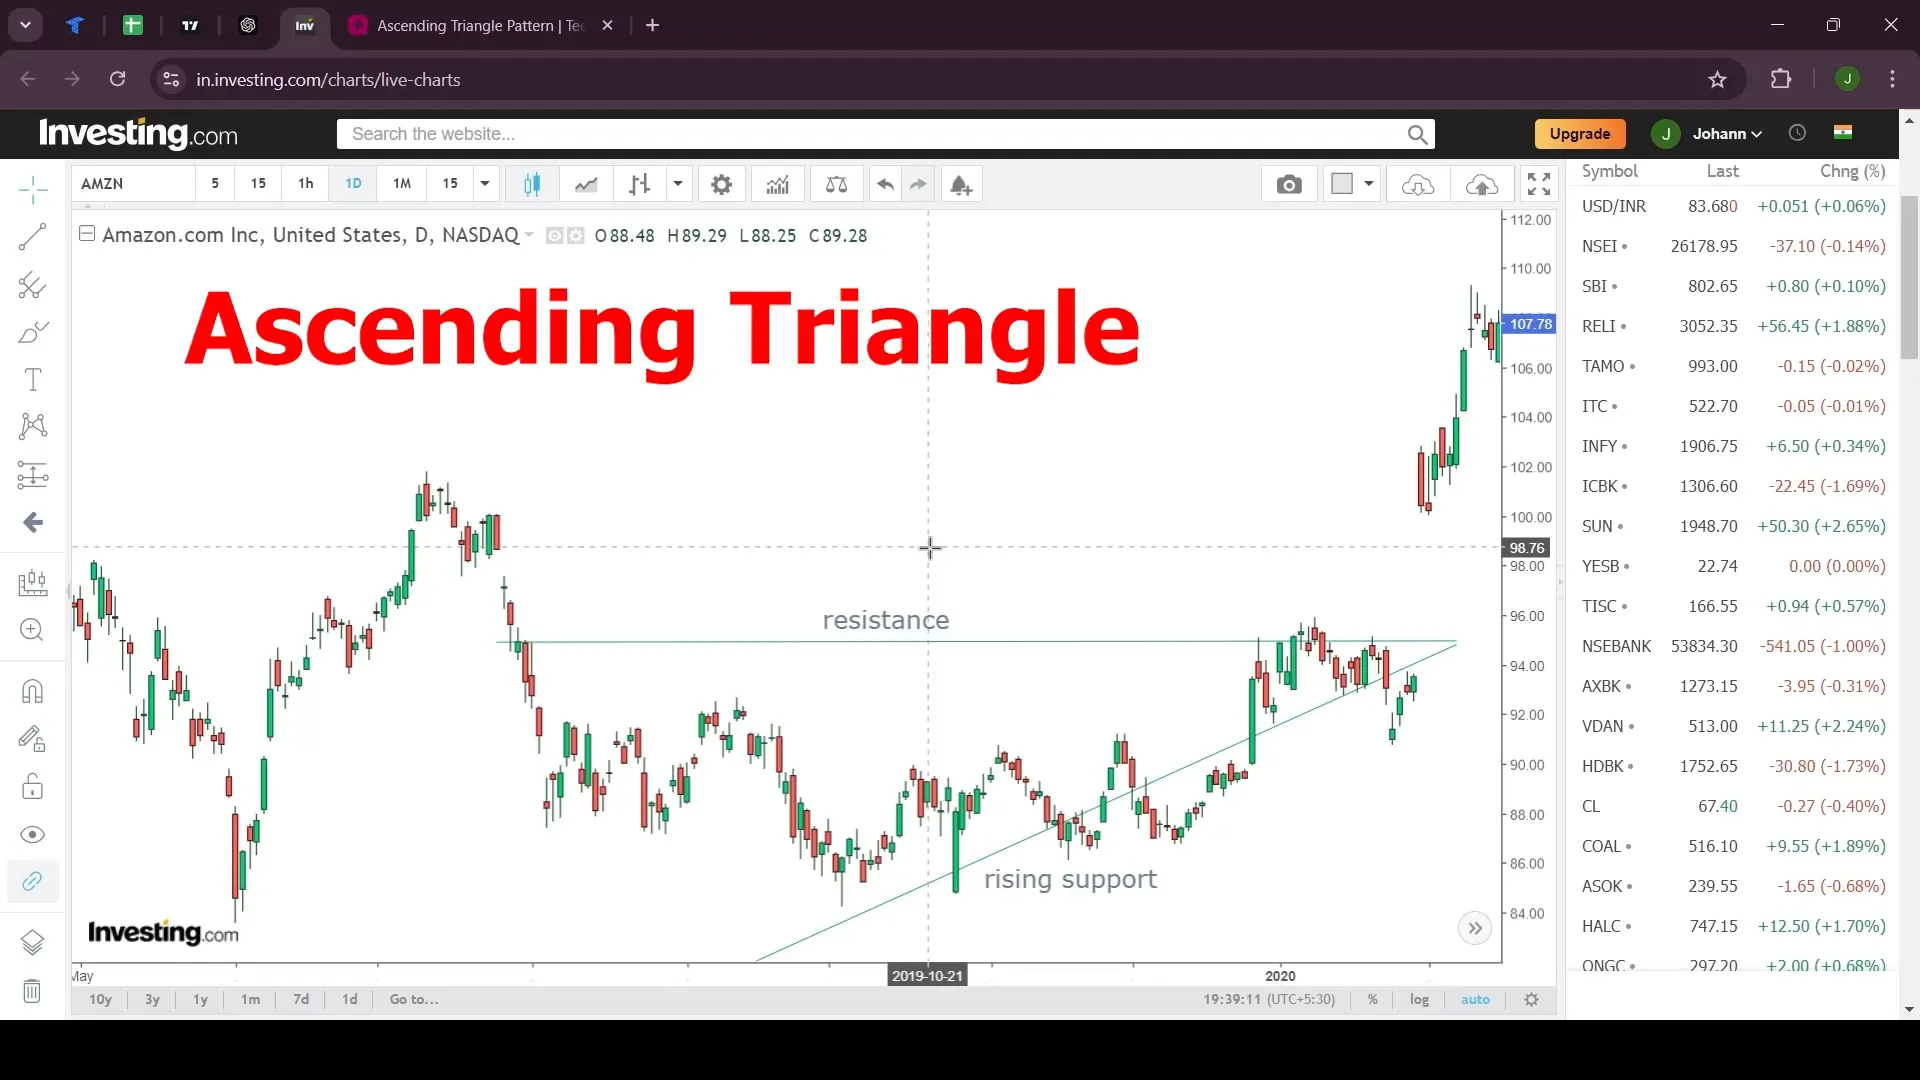
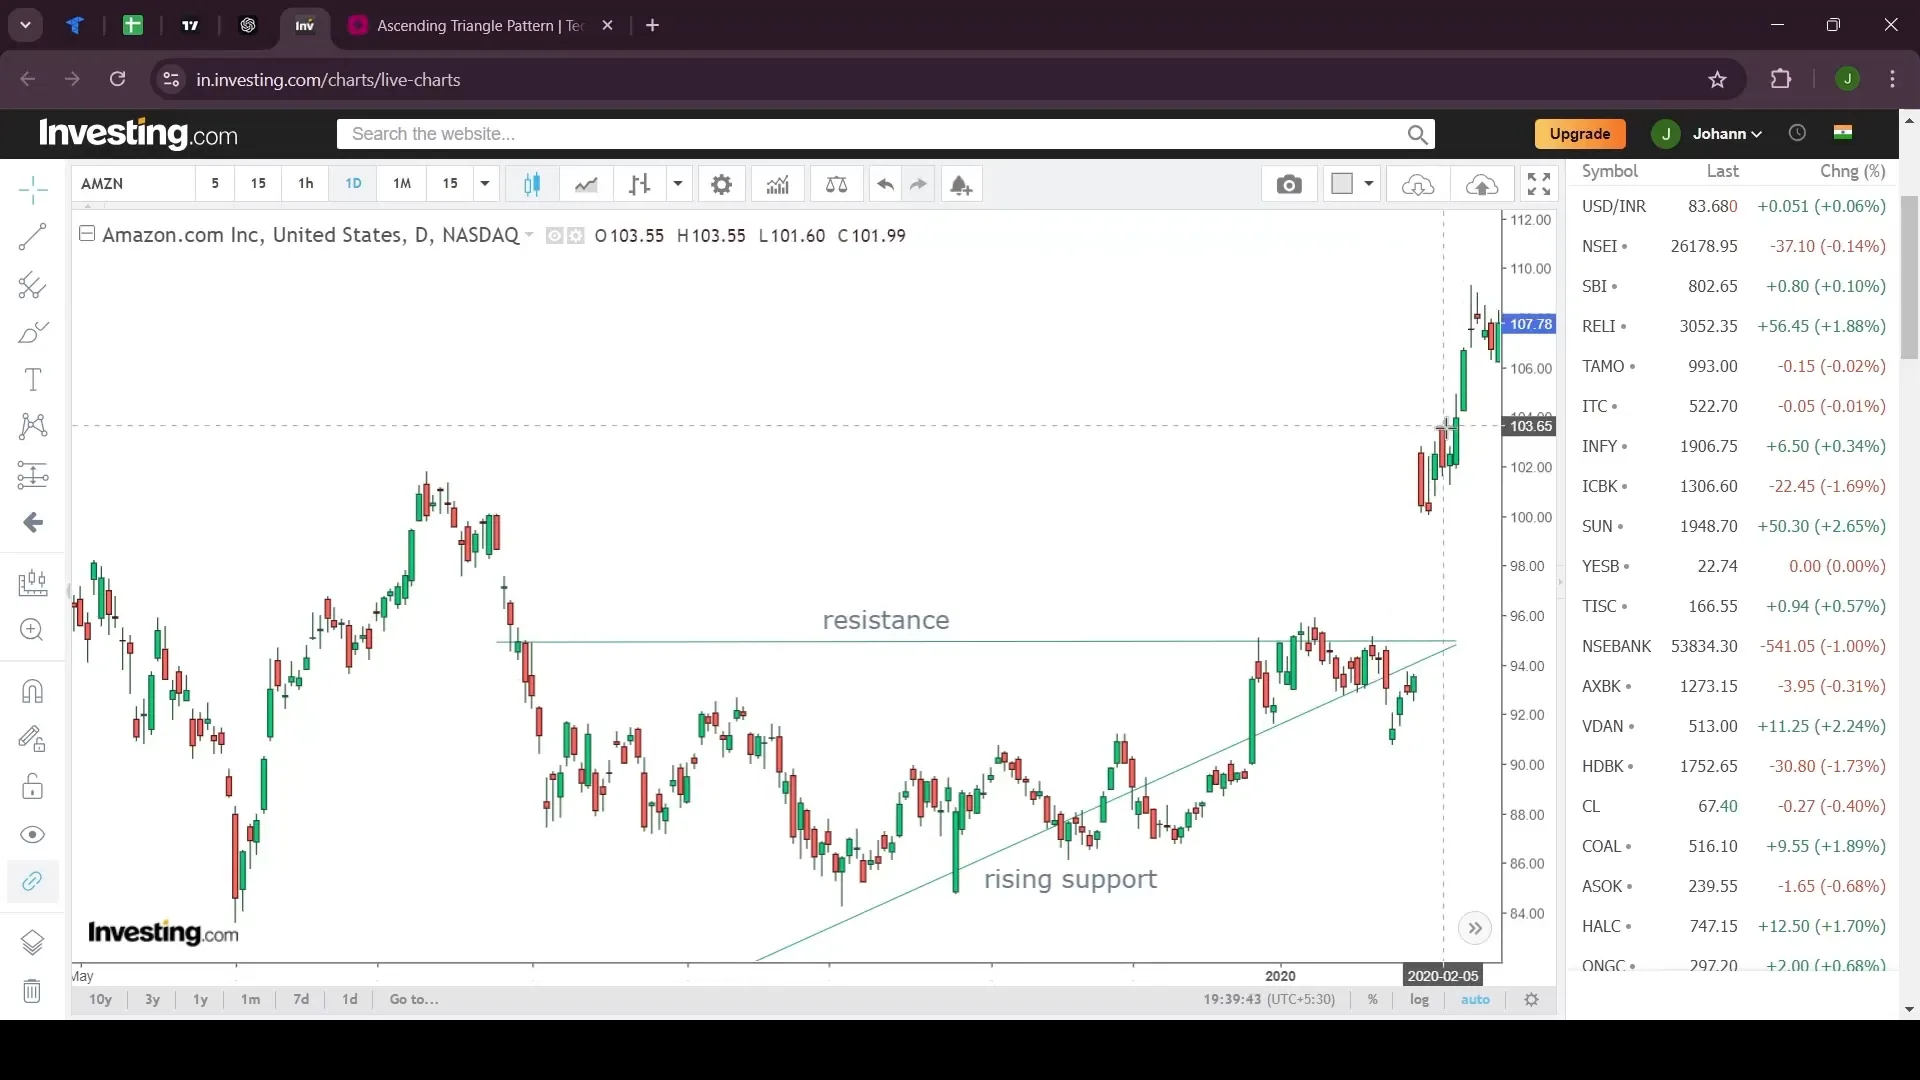
The Ascending Triangle is a bullish continuation pattern. It is characterized by a horizontal resistance line and an upward sloping support line. The pattern is confirmed when the price breaks above the resistance line.
Descending Triangle Pattern
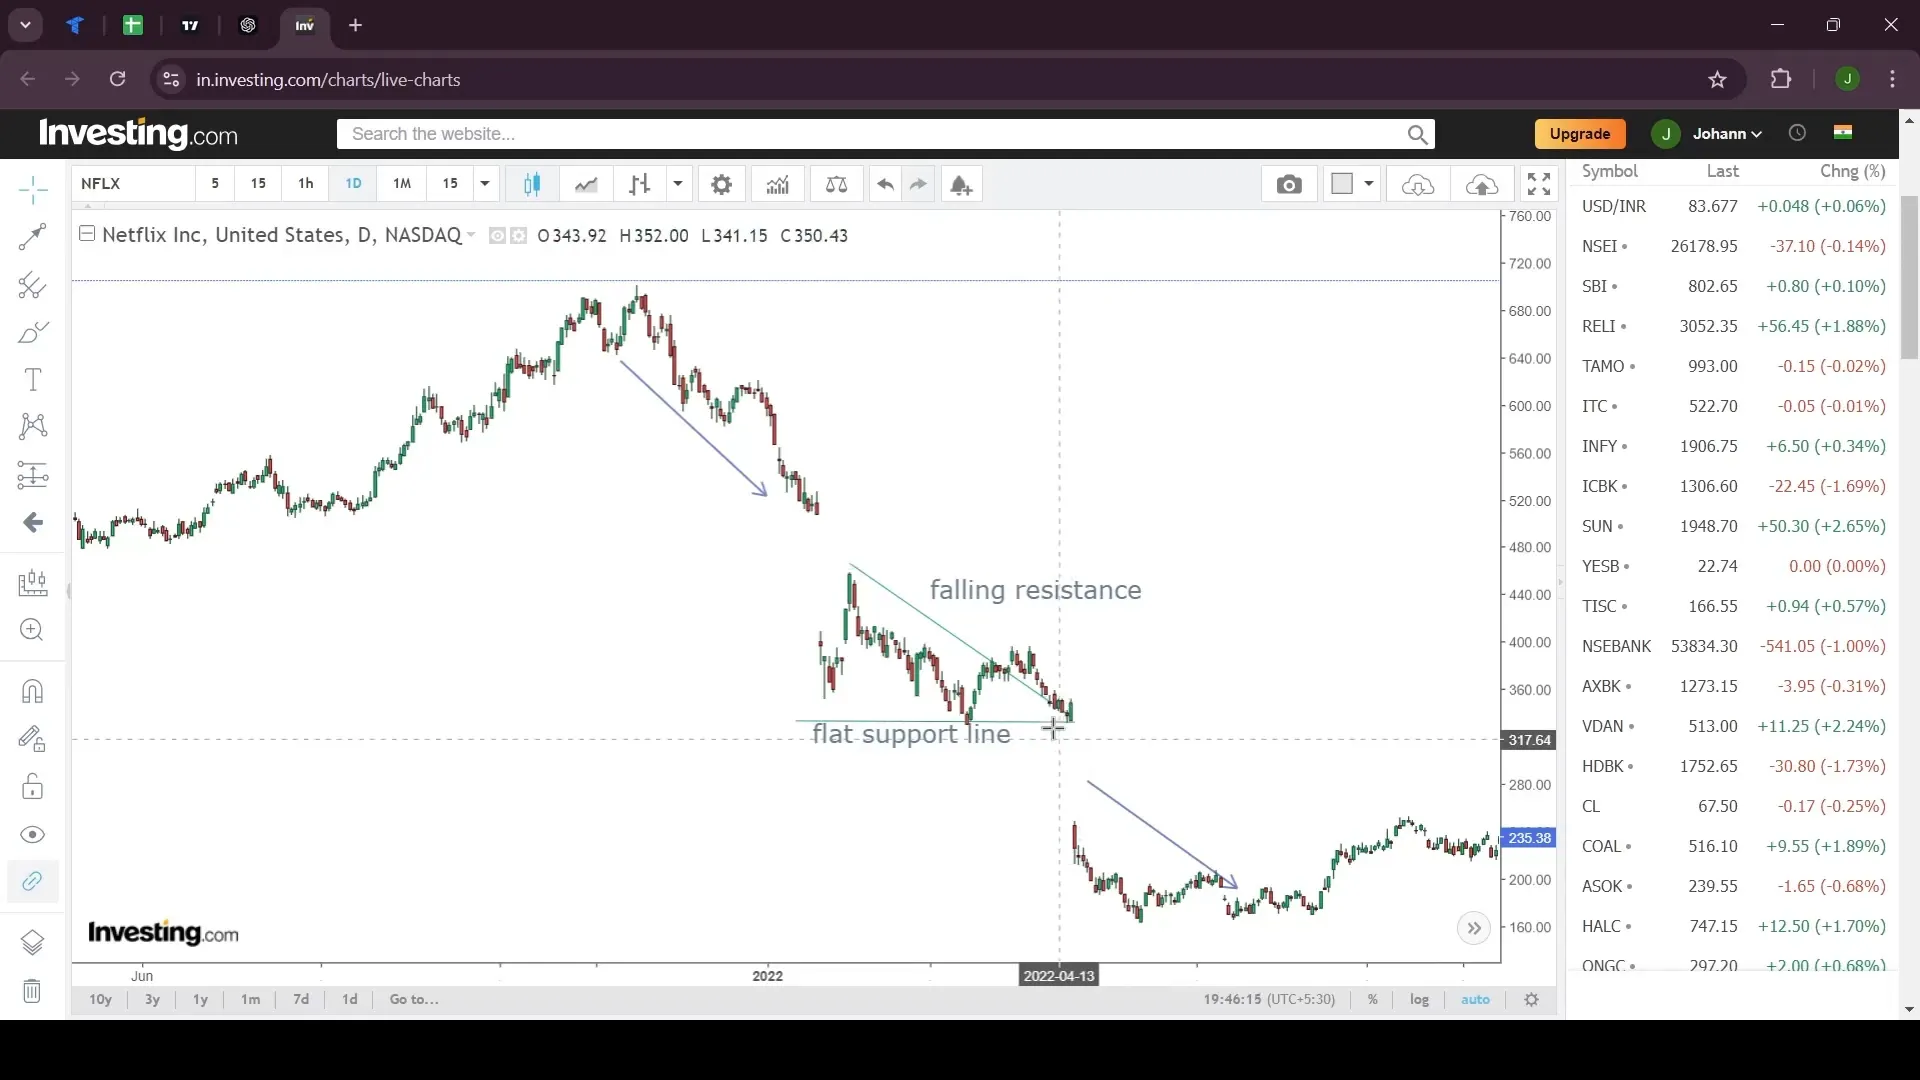
The Descending Triangle is a bearish continuation pattern, featuring a horizontal support line and a downward sloping resistance line. A break below the support line confirms the pattern and suggests further downward movement.
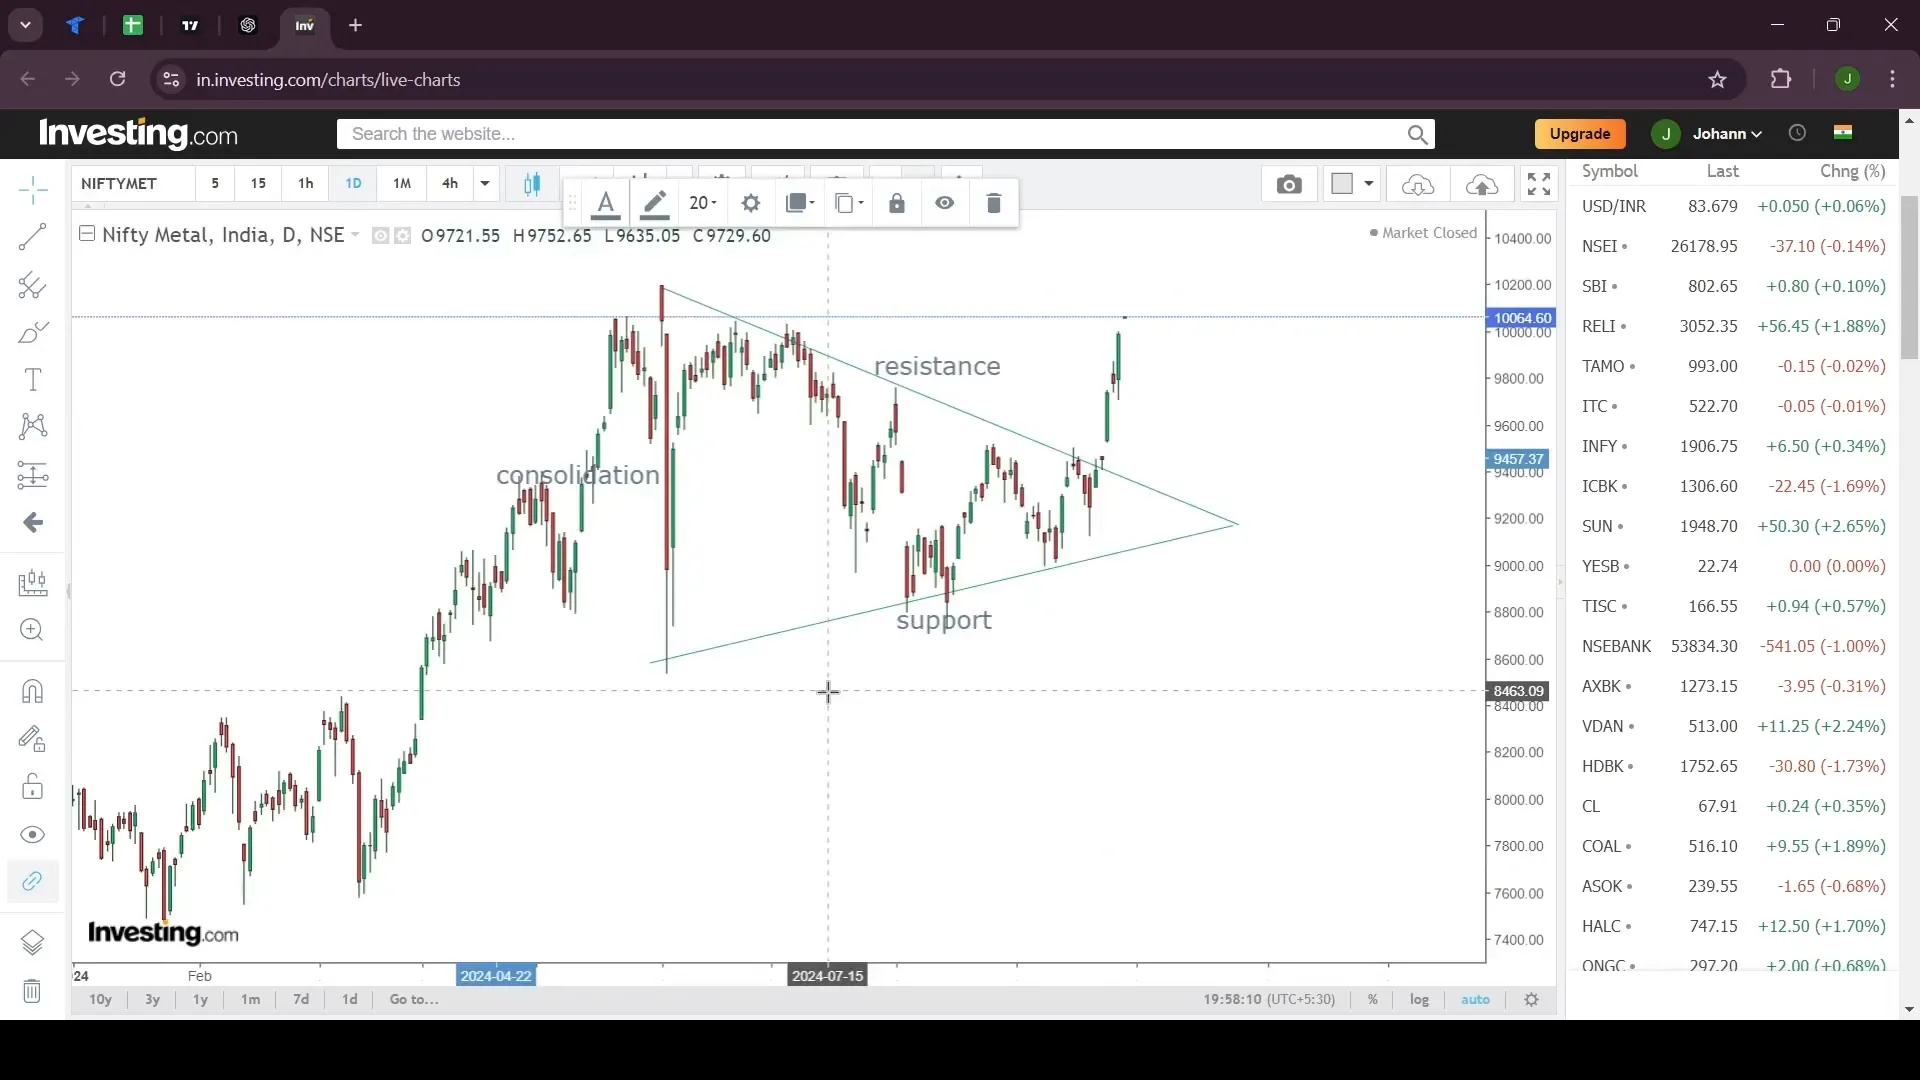
Symmetrical Triangle Pattern
The Symmetrical Triangle is a neutral pattern, characterized by converging trendlines. It indicates a period of consolidation and can result in a breakout in either direction, making it crucial for traders to monitor closely.
Stay tuned for more insights on mastering chart patterns with PickMyTrade, where we empower traders to make informed decisions through detailed technical analysis.
Step 7: Recognizing the Ascending Triangle
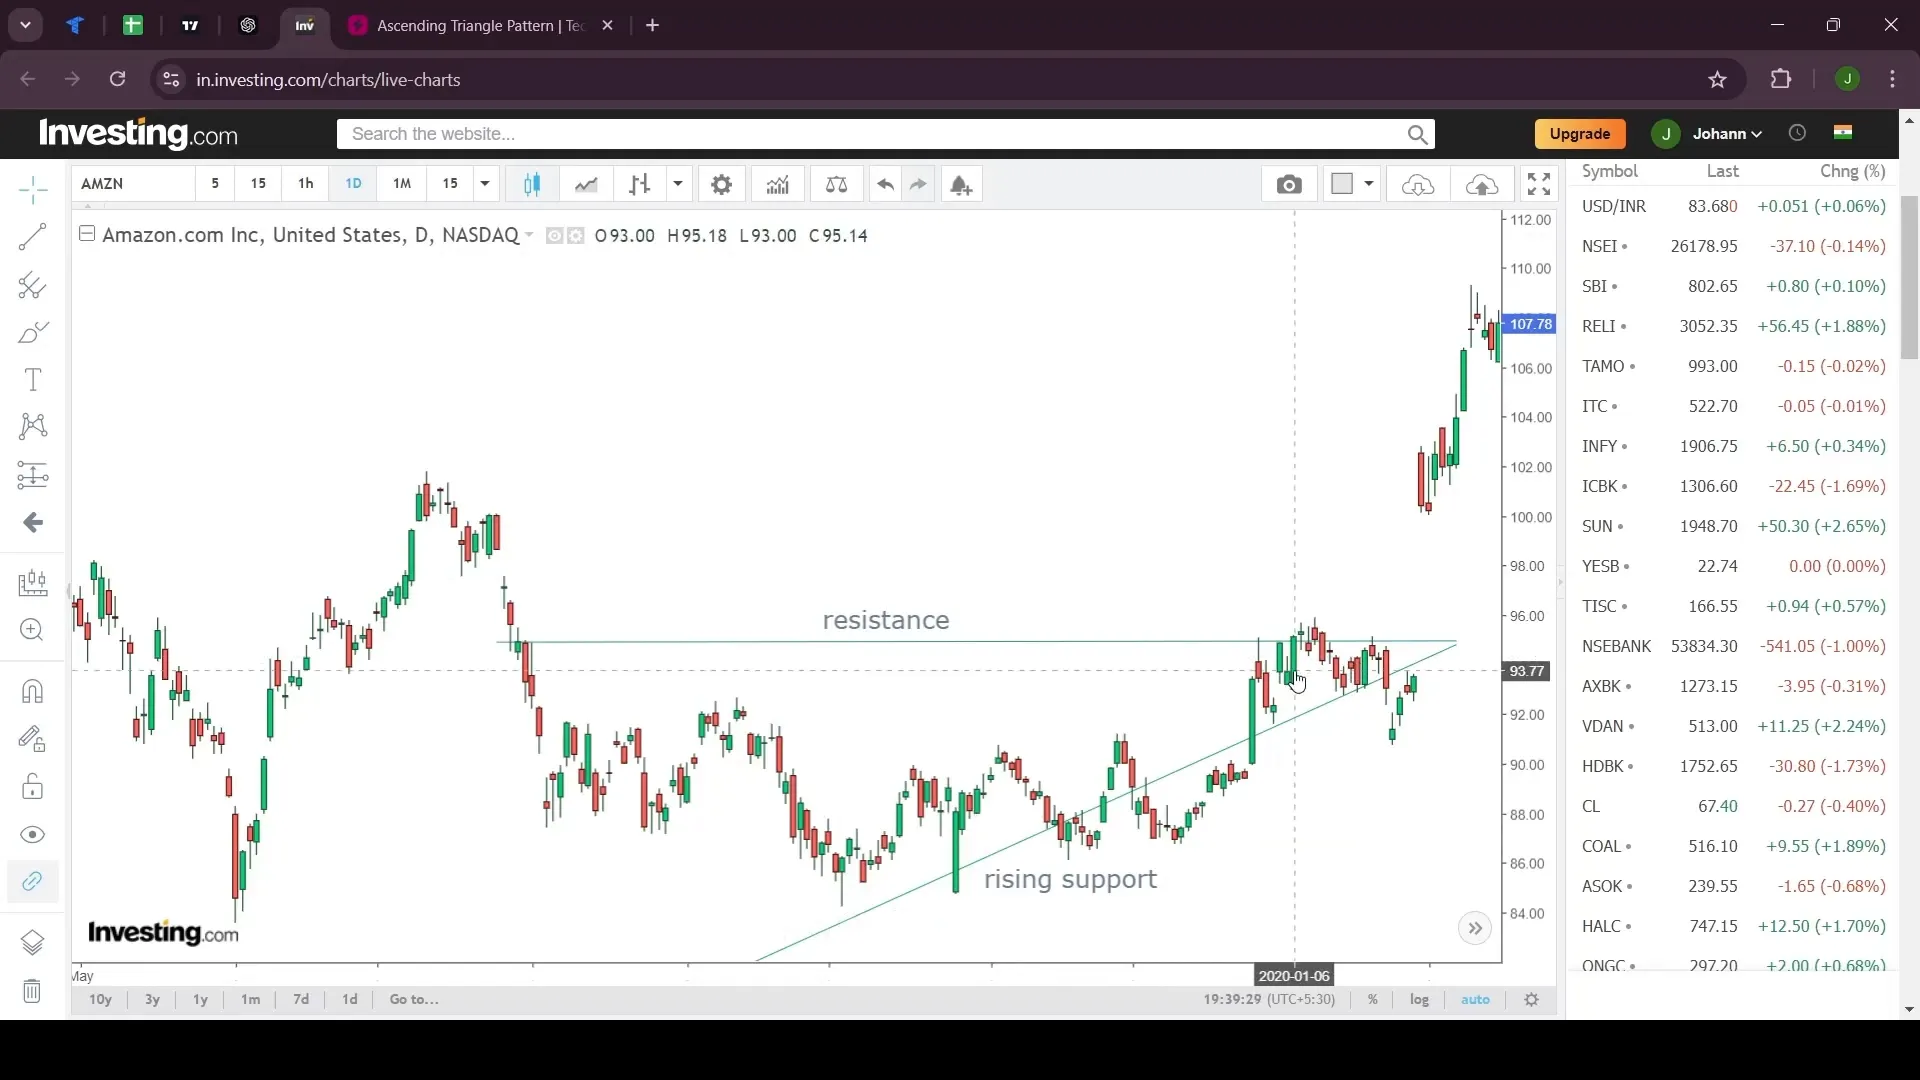
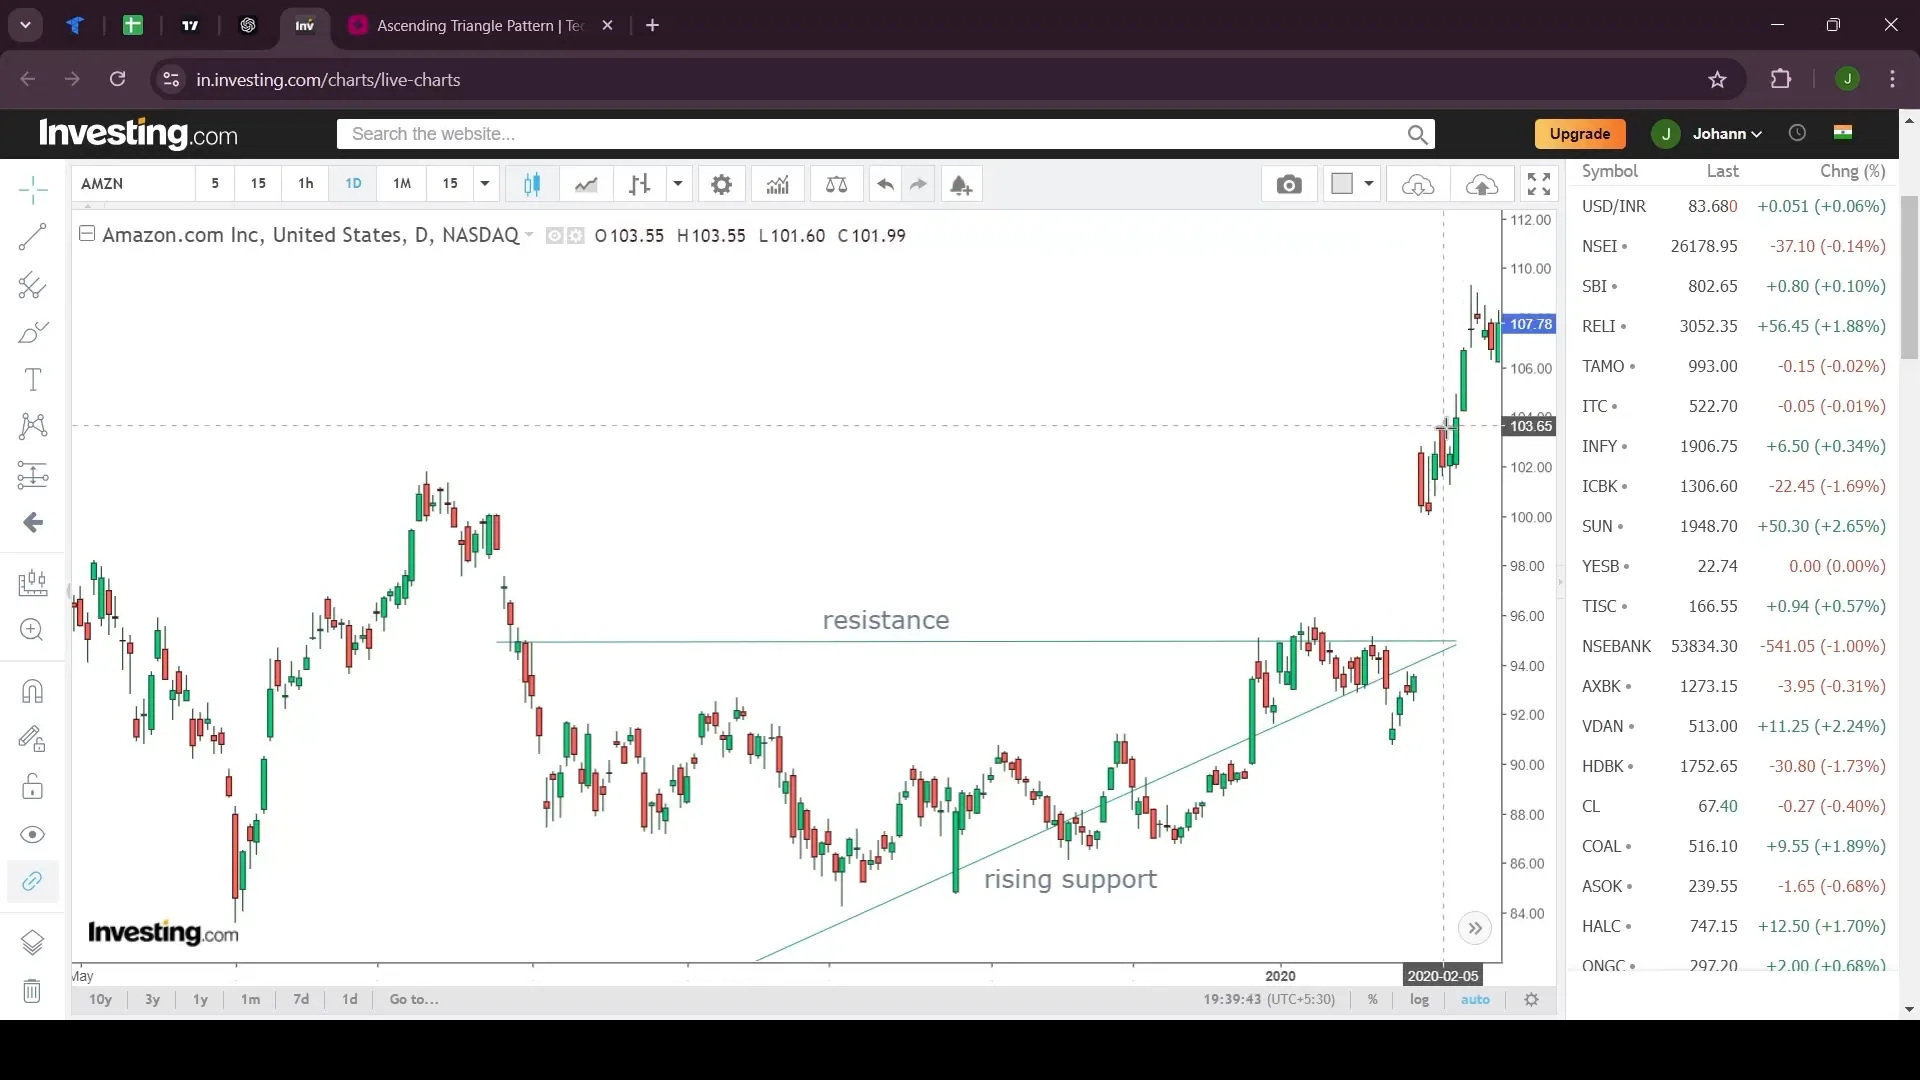
The Ascending Triangle is a powerful continuation pattern often seen in uptrends. It features a horizontal resistance line and an upward sloping support line, showing that buyers are gaining strength. This pattern suggests that once the resistance is broken, the price is likely to continue its upward trajectory.
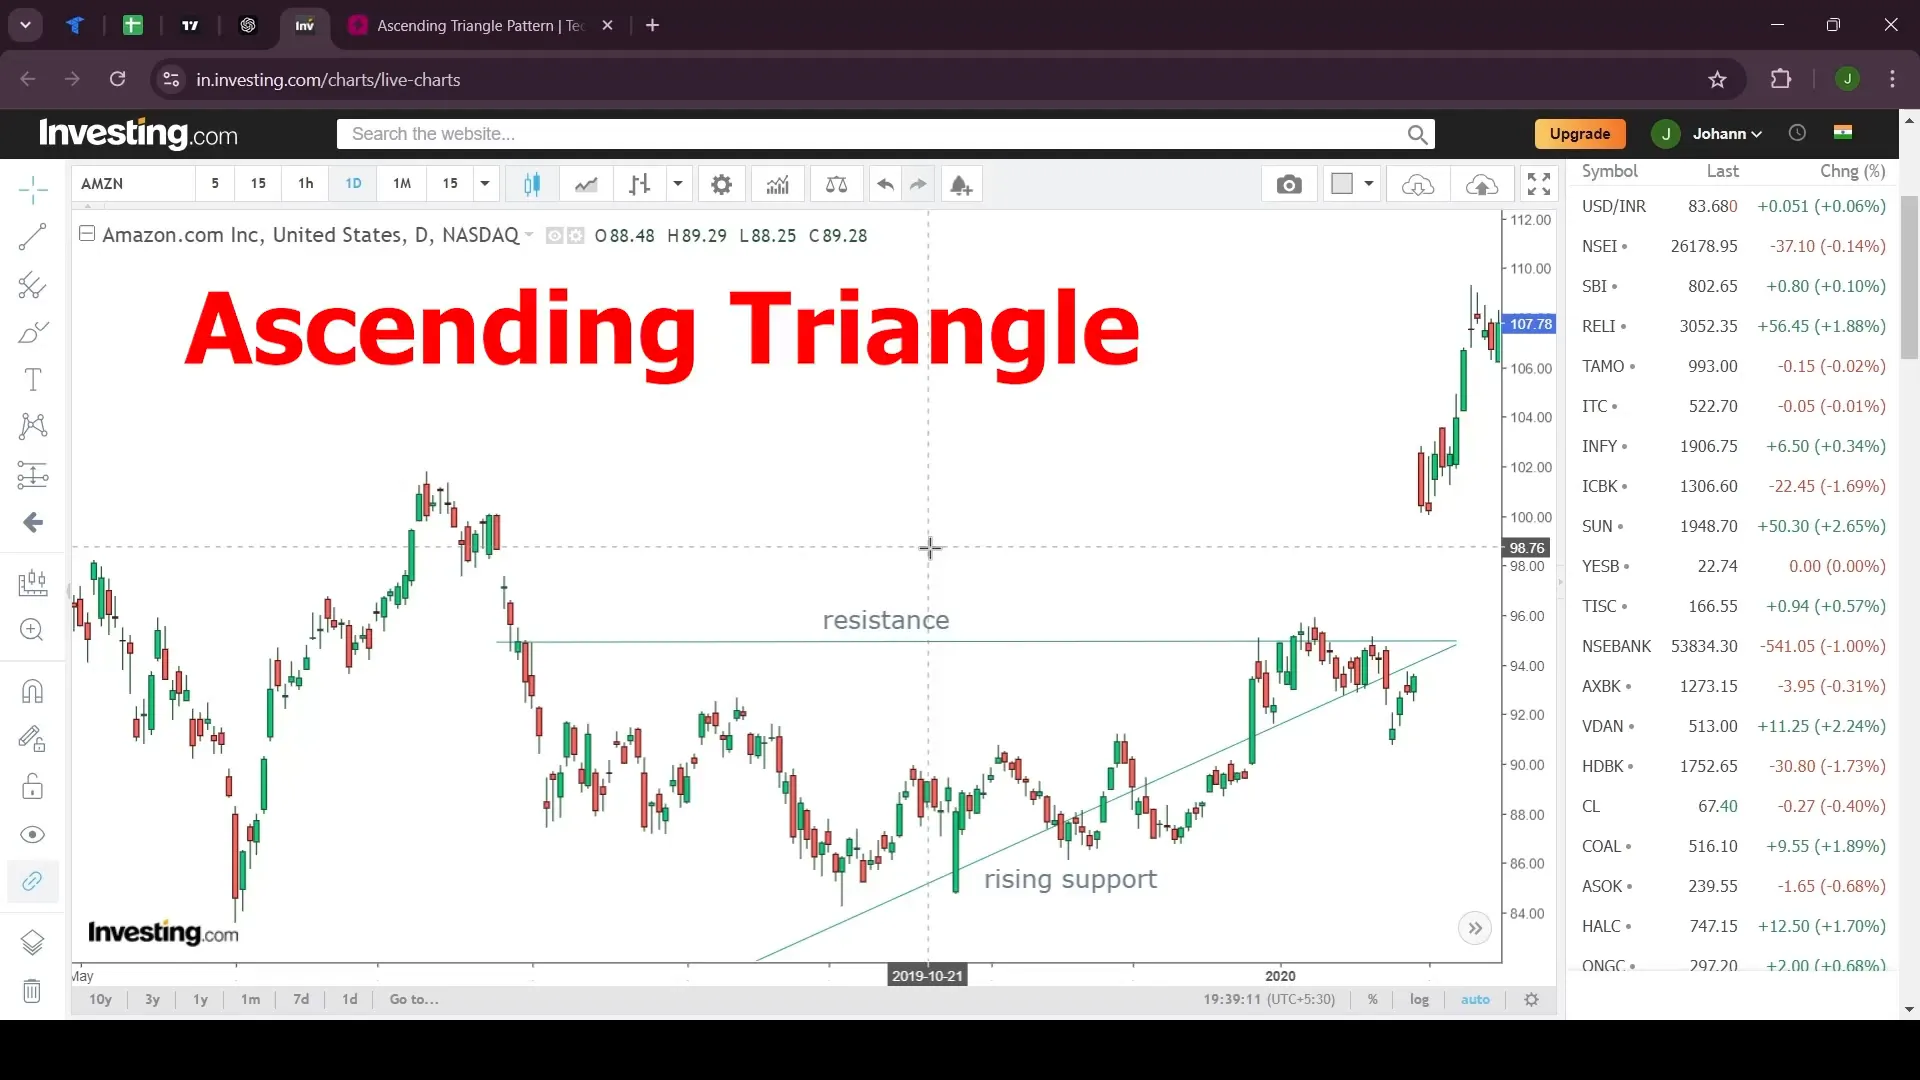
Traders can identify this pattern by looking for a series of higher lows that converge towards a flat resistance level. As the price consolidates, the pressure builds, often resulting in a breakout above the resistance line. This breakout is usually accompanied by increased volume, confirming the pattern’s validity.
Step 8: Identifying the Descending Triangle
The Descending Triangle is the bearish counterpart to the Ascending Triangle. It typically appears in downtrends, characterized by a horizontal support line and a downward sloping resistance line. This pattern indicates that sellers are in control, and a break below the support line could lead to further declines.
To spot a Descending Triangle, watch for a series of lower highs converging towards a consistent support level. Once the price breaches this support, it confirms the pattern and signals a potential continuation of the downtrend. Traders often look for increased selling volume to validate the breakout.
Step 9: Exploring the Symmetrical Triangle
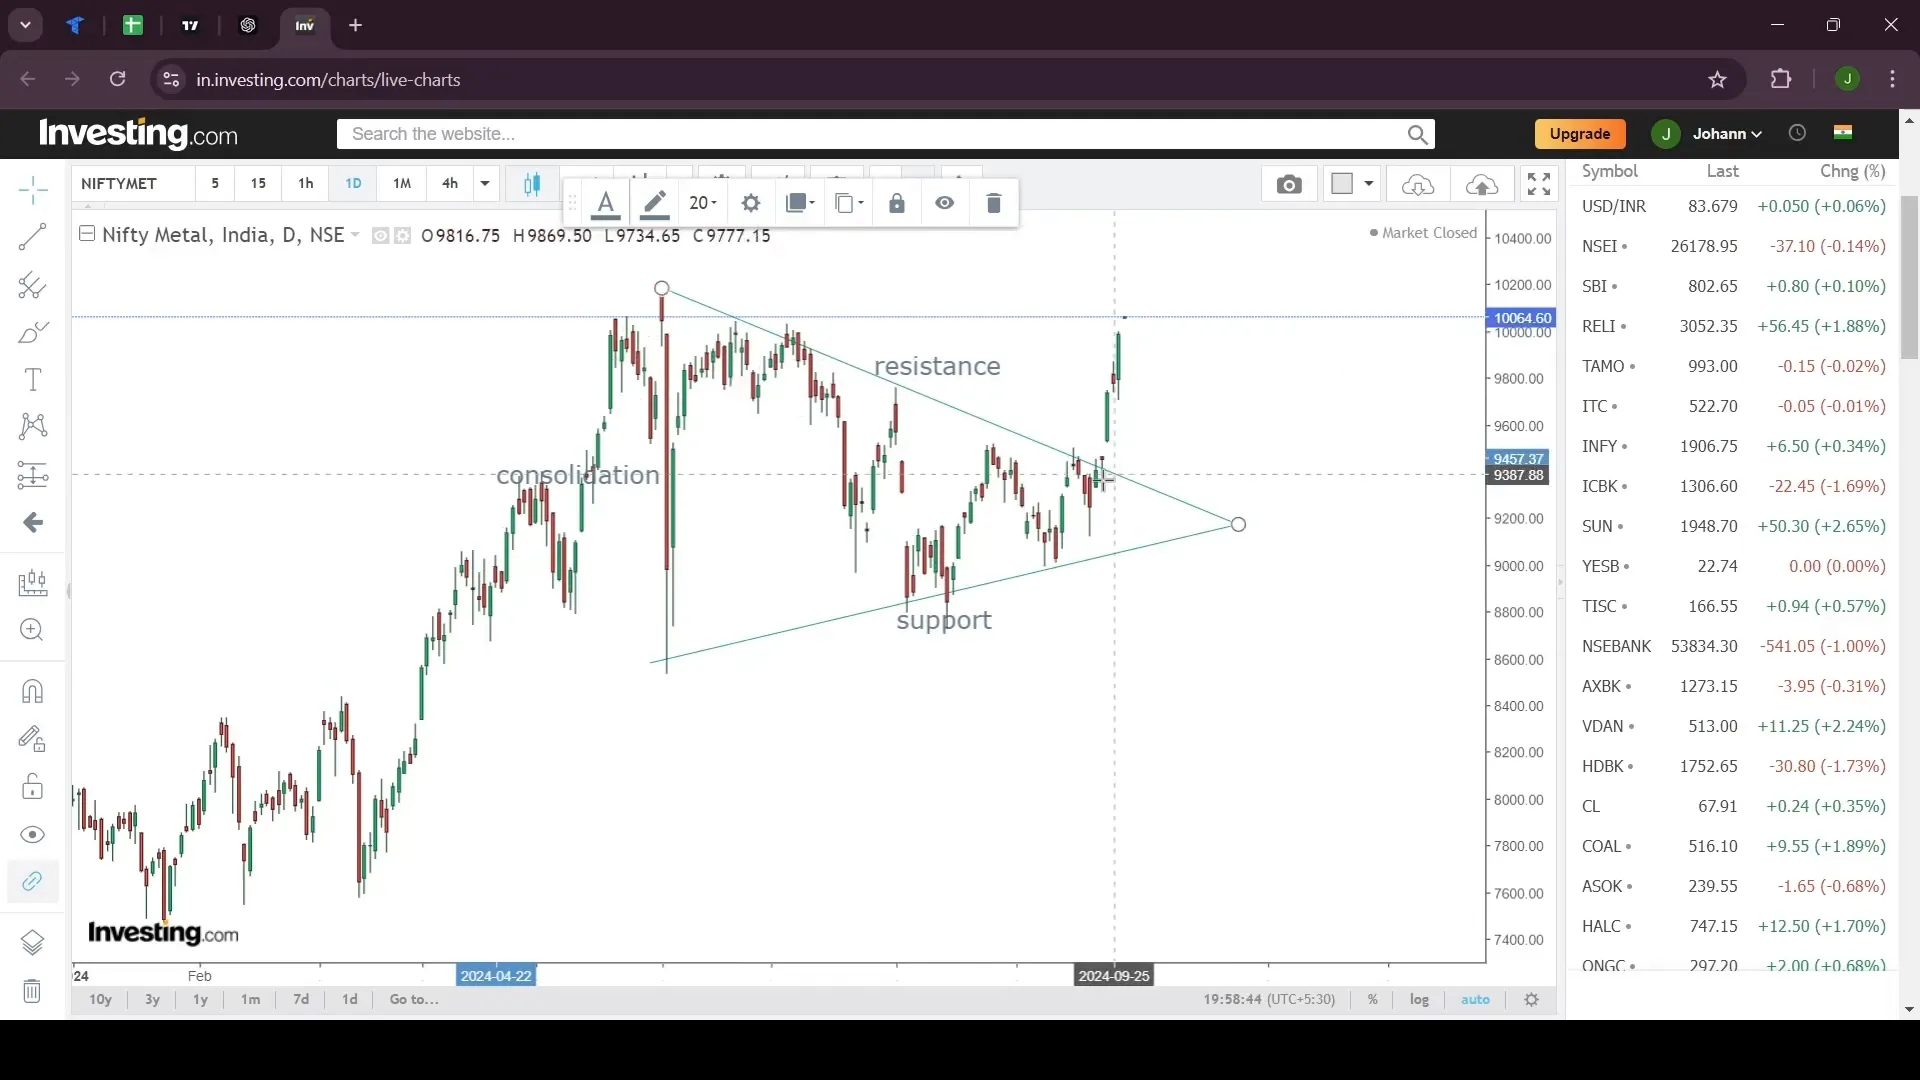
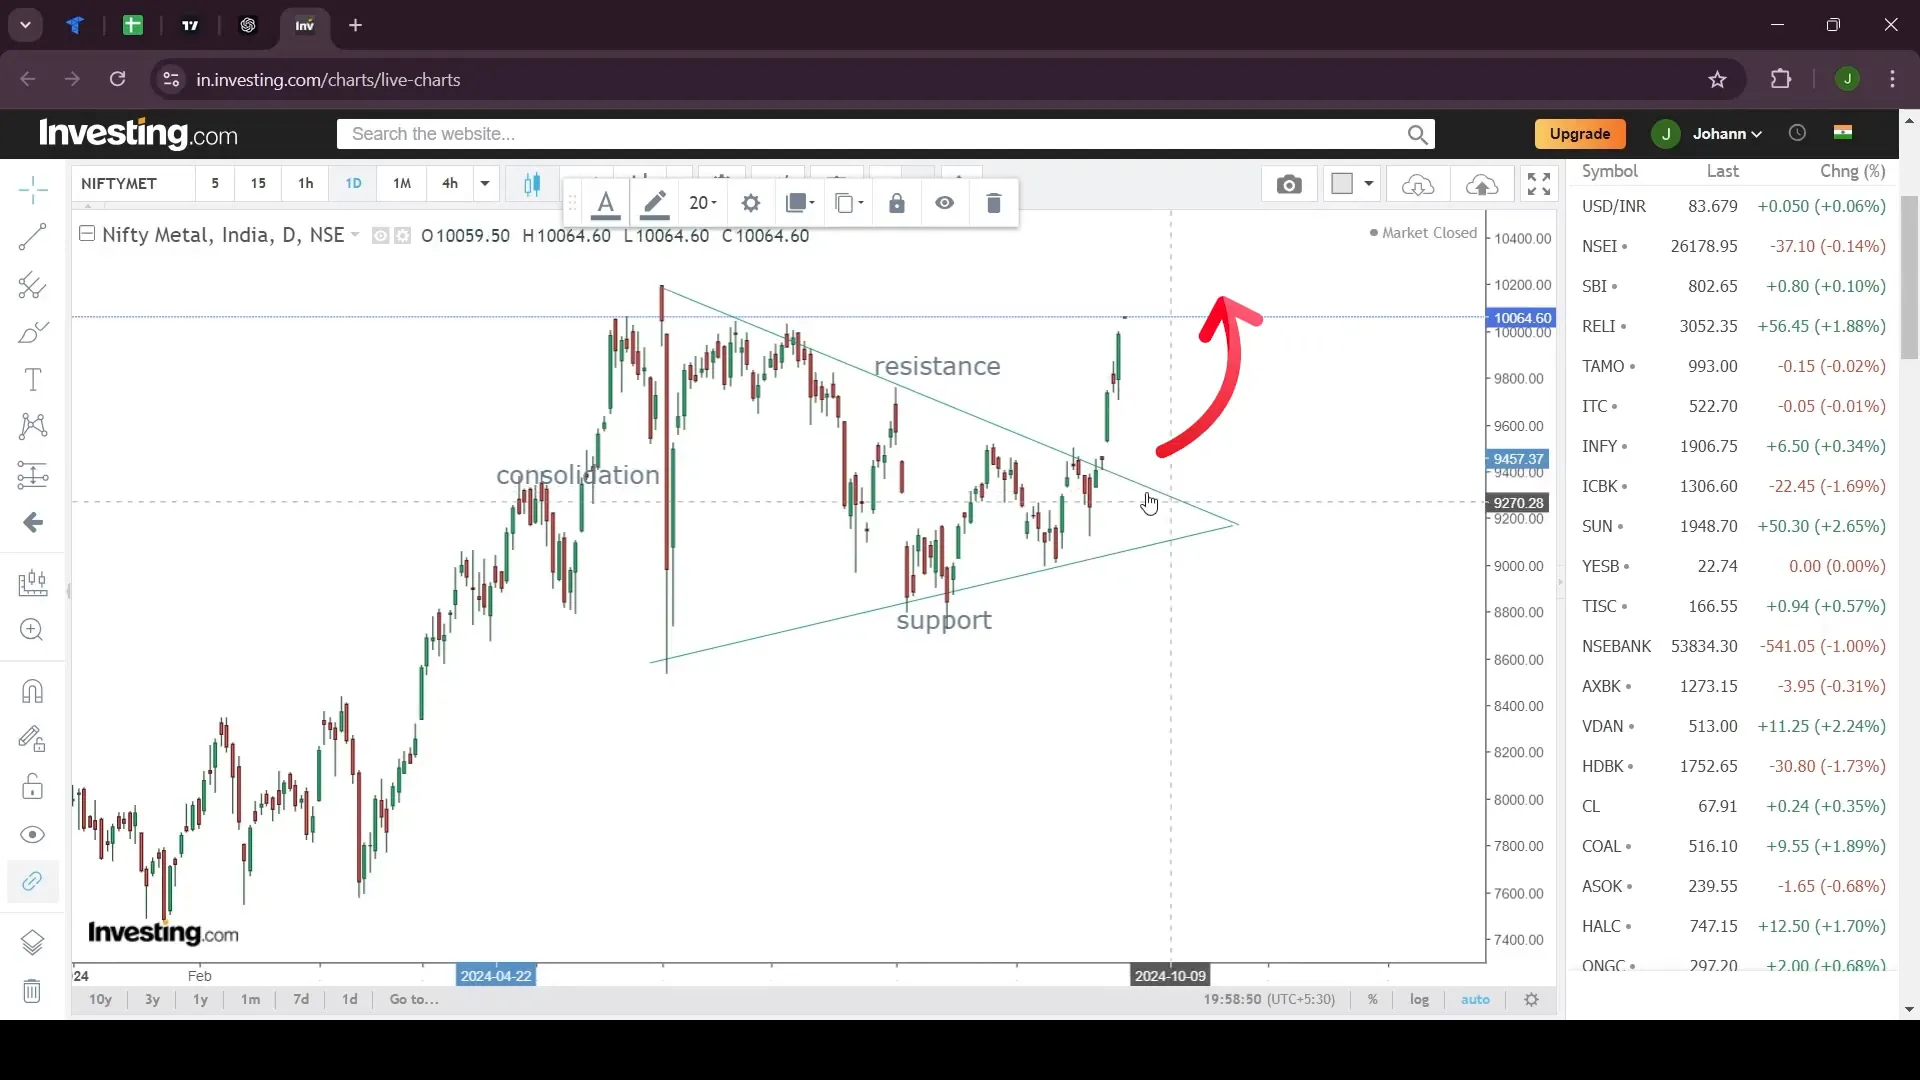
The Symmetrical Triangle is a neutral pattern that can lead to a breakout in either direction. It consists of converging trendlines where both the resistance and support lines slope towards each other. This pattern reflects a period of consolidation before a significant price movement.
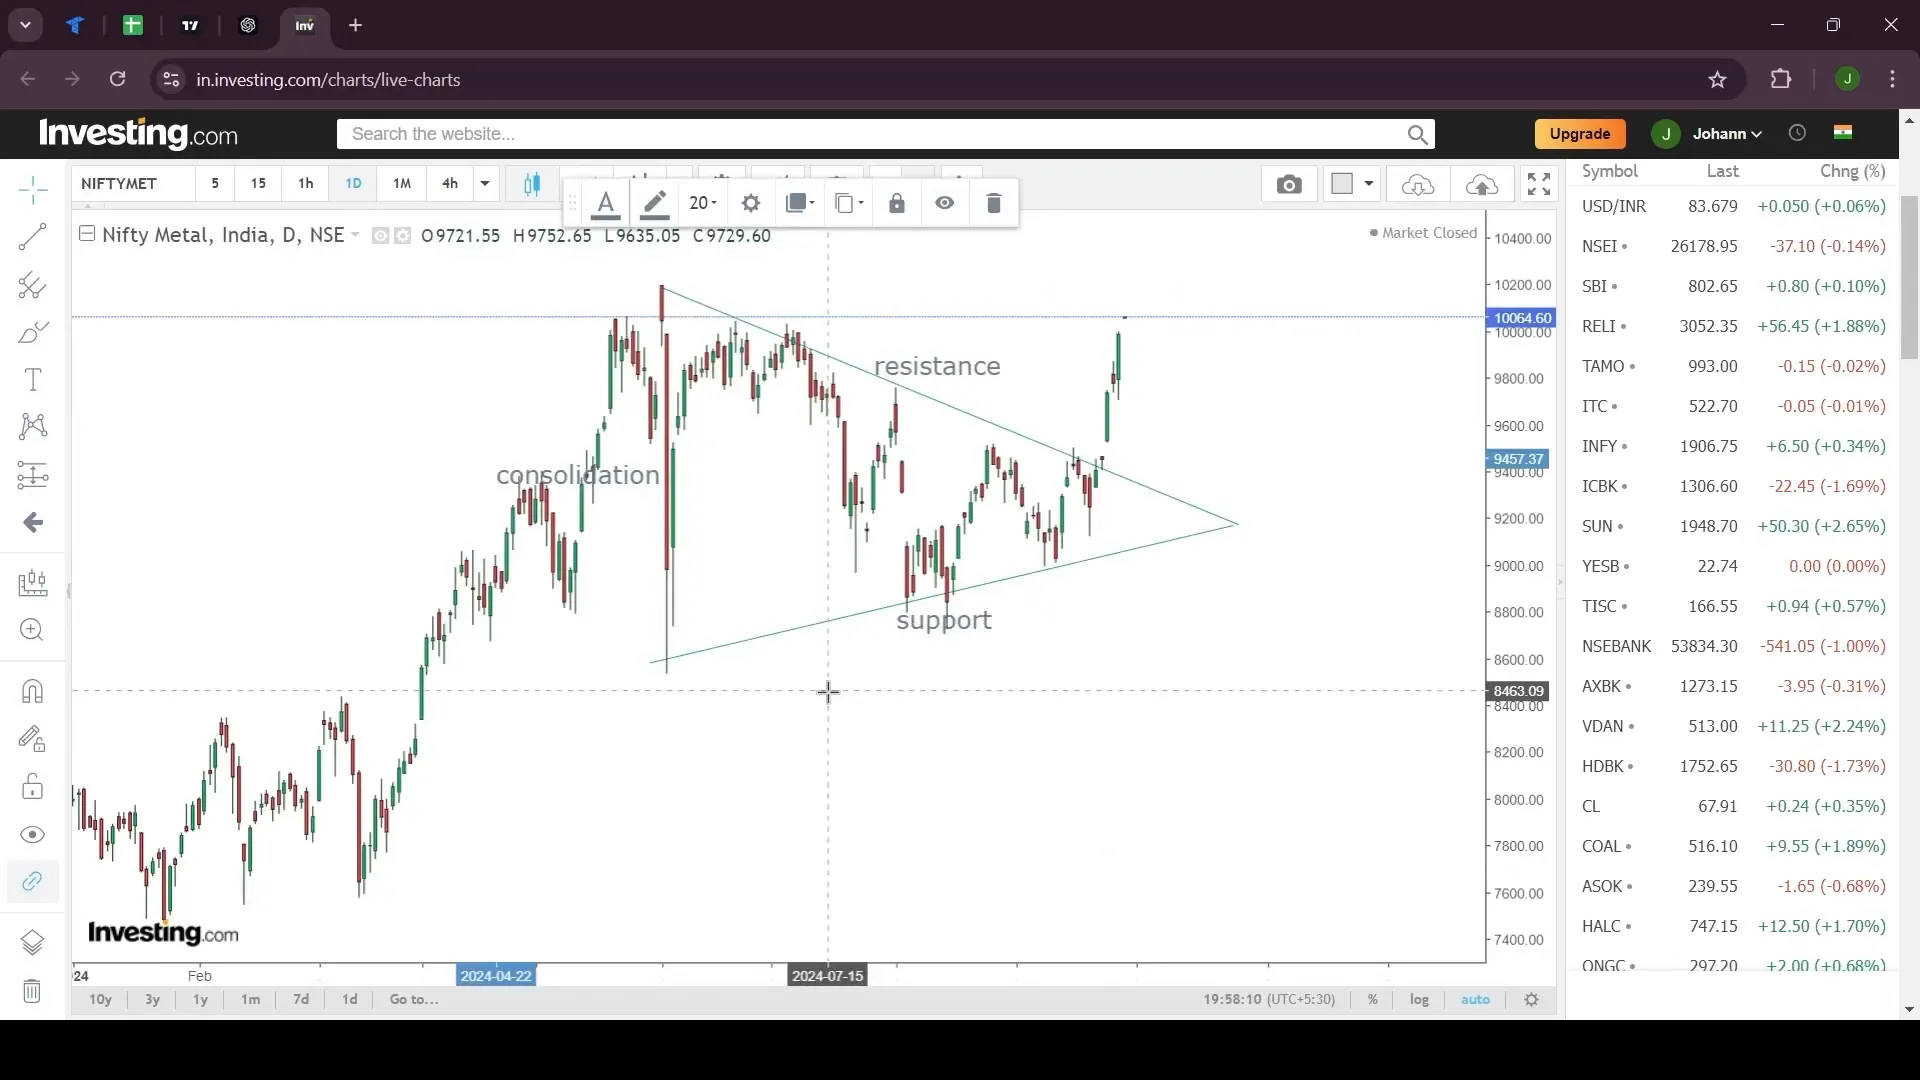
Traders can identify a Symmetrical Triangle by observing the price action as it forms a series of lower highs and higher lows. The breakout direction can be challenging to predict, so it’s crucial to watch for a decisive move beyond the converging trendlines, supported by strong volume.
Step 10: Understanding Wedges
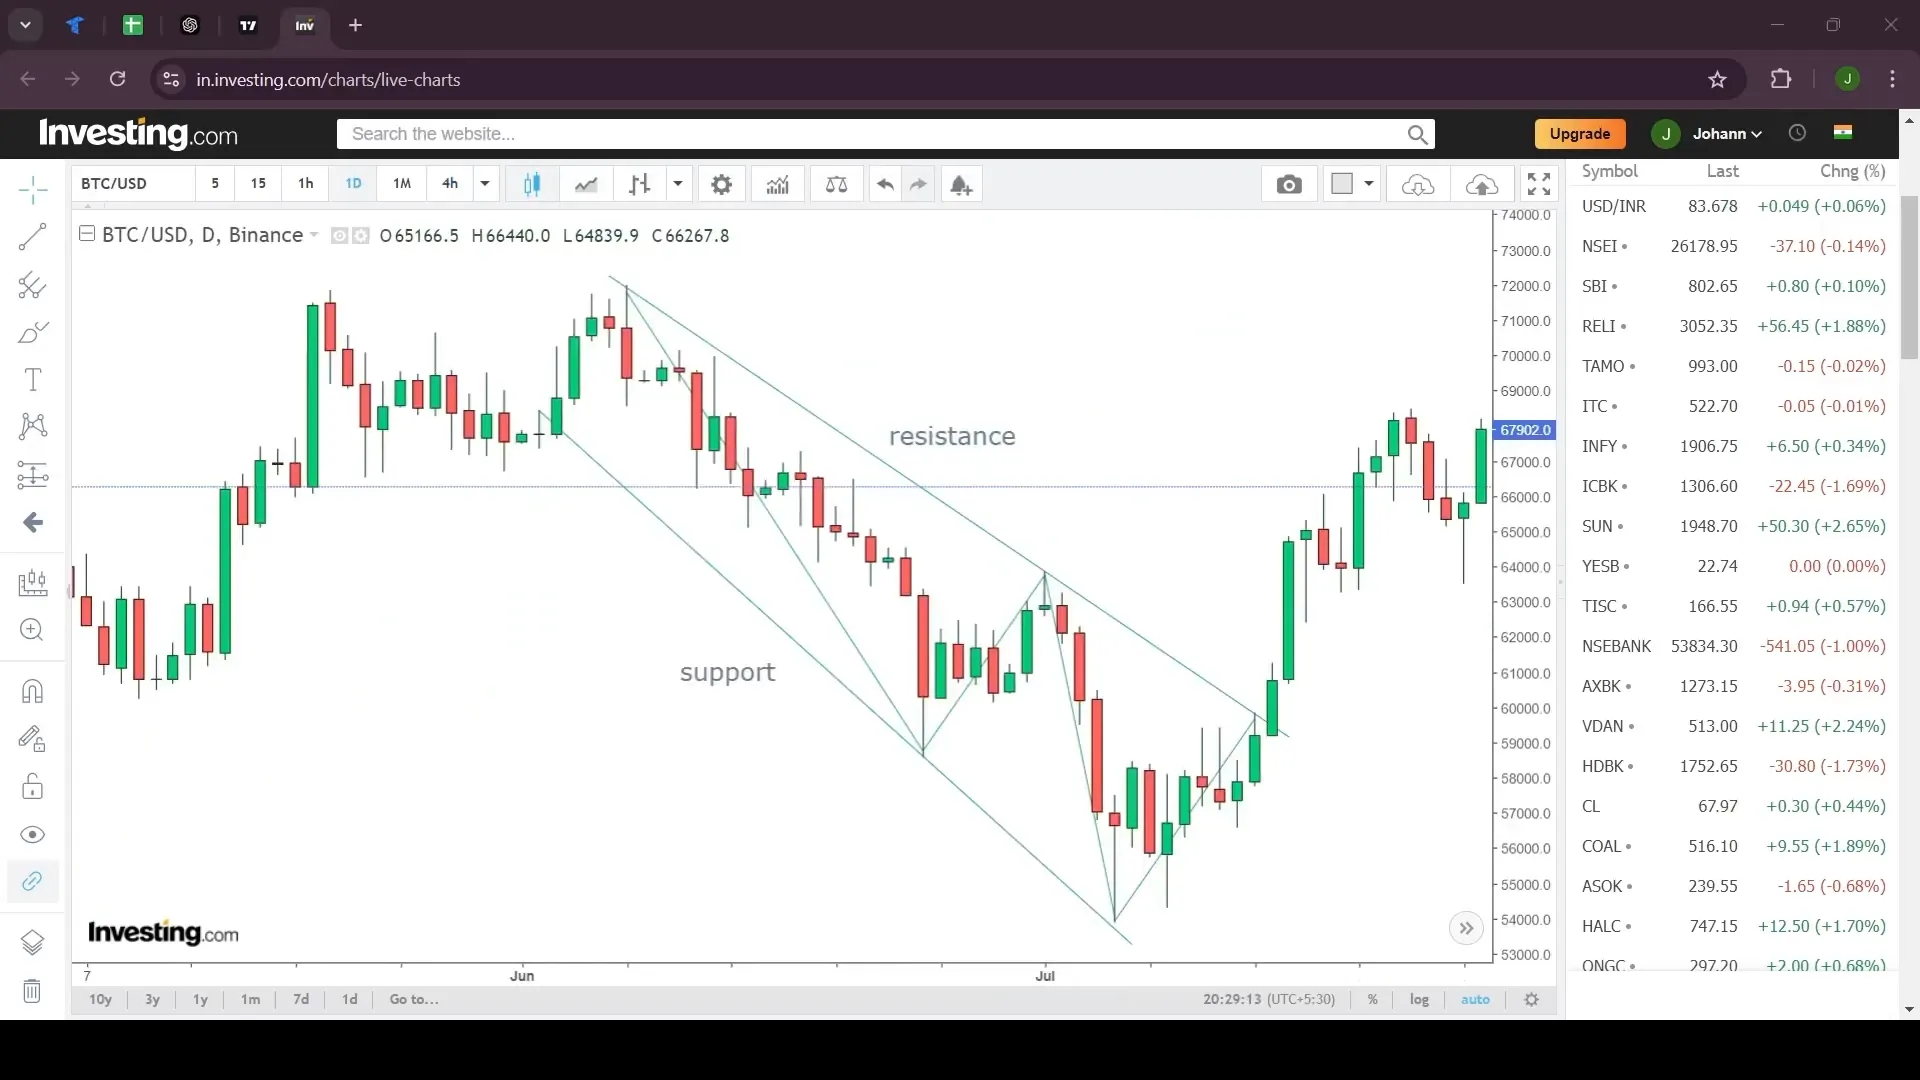
Wedges are another type of chart pattern that can signal potential reversals. There are two types of wedges: the Rising Wedge and the Falling Wedge. The Rising Wedge is a bearish pattern that forms during uptrends, while the Falling Wedge is a bullish pattern that appears in downtrends.
The Rising Wedge is identified by two upward sloping trendlines that converge. It suggests that the upward momentum is weakening, and a break below the lower trendline could lead to a reversal. Conversely, the Falling Wedge features two downward sloping lines that converge, indicating a potential bullish reversal once the upper trendline is broken.
Step 11: Conclusion and Final Thoughts
Mastering these chart patterns can significantly enhance your trading skills. Whether you’re analyzing stocks, Forex, or cryptocurrencies, recognizing these formations early can provide a strategic advantage. By incorporating these patterns into your trading toolkit, you can make more informed decisions, manage risks better, and potentially increase your profitability.
PickMyTrade offers a wealth of resources and tools to help traders understand and apply these patterns effectively. Dive deeper into technical analysis with PickMyTrade and elevate your trading strategies today.
FAQ: Common Questions about Chart Patterns
- What is the importance of volume in confirming chart patterns? Volume is crucial as it confirms the strength of a breakout or reversal. Increased volume during a breakout suggests strong market interest and enhances the pattern’s reliability.
- Can chart patterns be used in all time frames? Yes, chart patterns can be applied across various time frames, from intraday to weekly charts. However, longer time frames typically provide more reliable signals.
- How do I decide which chart pattern to use in my trading strategy? The choice of chart pattern depends on your trading style and market conditions. Continuation patterns are useful in trending markets, while reversal patterns are beneficial in identifying potential trend changes.
For more insights on technical analysis and trading strategies, visit PickMyTrade, where we empower traders with knowledge and tools to succeed in the market.
PickMyTrade specializes in automating trading bots, enabling seamless strategy execution for futures from platforms like TradingView, across well-known brokers such as Tradovate.
PickMyTrade
PickMyTrade specializes in automating trading bots, enabling seamless strategy execution for futures from platforms like TradingView, across well-known brokers such as Tradovate.

